IMAGE

Fig. 3

ID
ZDB-IMAGE-210307-61
Source
Figures for Hans et al., 2021
Image
Figure Caption

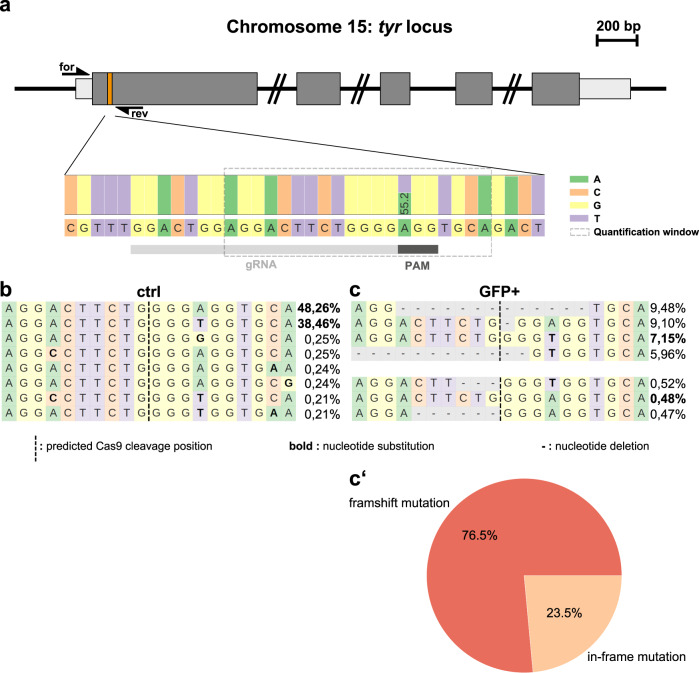
Fig. 3 Sequencing confirms high mutagenesis rates following Cas9-GFP expression.

a Scheme of the tyr locus at chromosome 15. Exon sequences with translated and untranslated regions are represented in dark and light gray, respectively. Position of the CRISPR/Cas9 target in the first exon is indicated with an orange box. Forward and reverse primers used for amplification of the target site (for and rev) are shown as half arrows. Scale bar: 200 base pairs (bp). Next generation sequencing of FAC-sorted cells from pooled embryos (see Supplementary Fig. 1a) revealed a single-nucleotide polymorphism at the first position of the protospacer adjacent motif (PAM) indicated with a dark gray box downstream to the target site (gRNA) indicated by a light gray box. b, c Distribution of identified alleles around the cleavage site for the guide GGACTGGAGGACTTCTGGGG in control (ctrl) and GFP-positive cells (GFP+). Nucleotides are indicated by unique colors (A = green; C = red; G = yellow; T = purple). Substitutions are shown in bold font. Horizontal dashed lines indicate deleted sequences. The vertical dashed line indicates the predicted cleavage site. Sequencing of controls (b) shows presence of the parental strands with a frequency of 48.26 and 38.46% which drops to 7.15 and 0.48% in GFP-positive cells (c). c′ Further sequence analysis of GFP-positive cells shows that 76.5 and 23.5% of the introduced indels represent frameshift and in-frame mutations, respectively.

Acknowledgments
This image is the copyrighted work of the attributed author or publisher, and ZFIN has permission only to display this image to its users. Additional permissions should be obtained from the applicable author or publisher of the image. Full text @ Nat. Commun.