
|
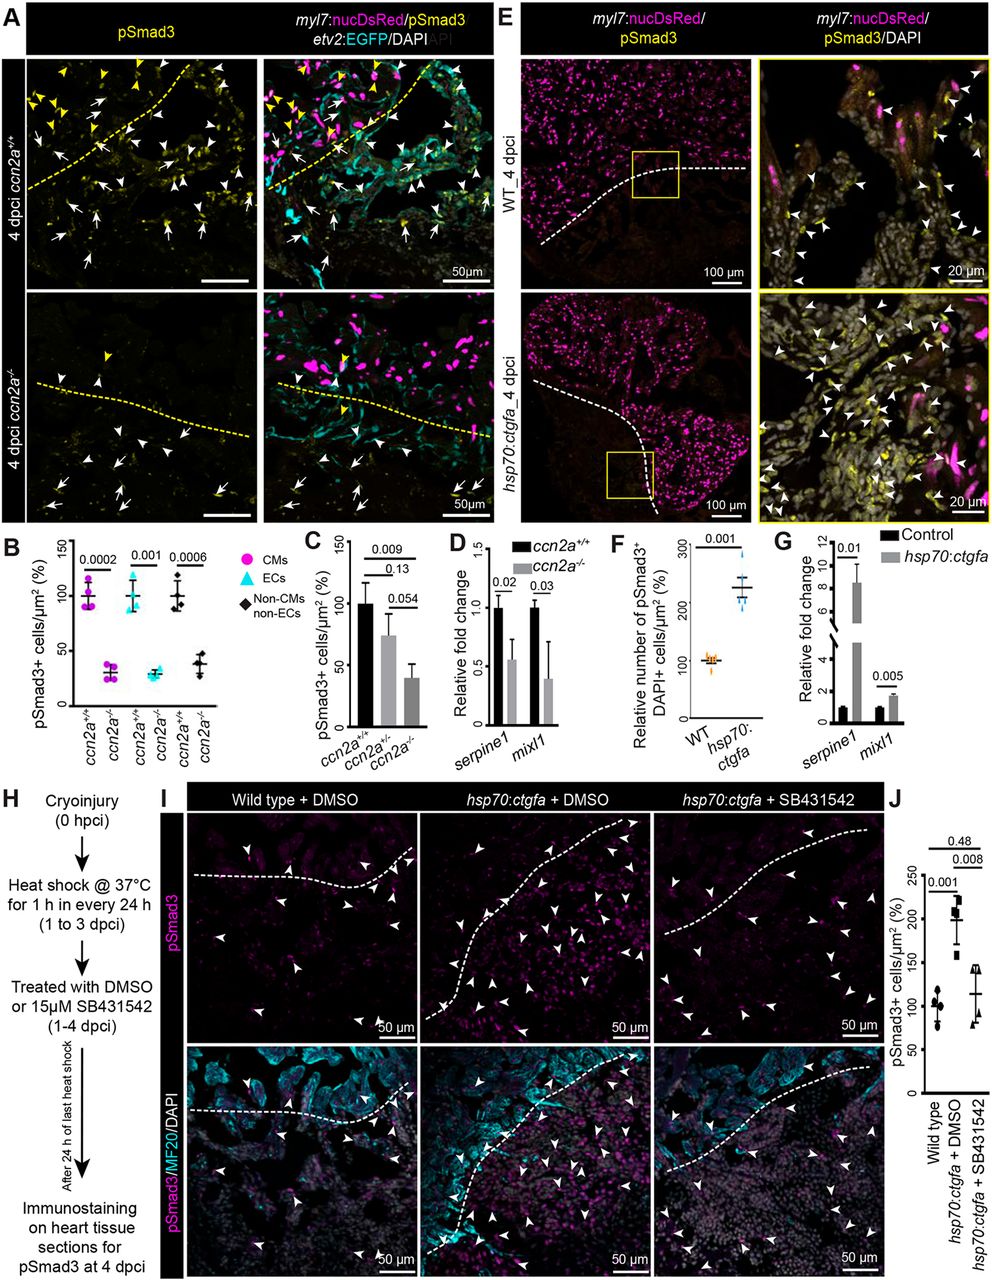
Fig. 7 Ccn2a levels positively modulate nuclear pSmad3 localization in injured hearts. (A) Maximum intensity projections of confocal images of sagittal cryosections of 4 dpci hearts expressing DsRed in CM nuclei (magenta) and EGFP in endocardial/endothelial cells (cyan), immunostained for pSmad3 (yellow) and stained with DAPI (white; marks all nuclei). Yellow and white arrowheads indicate DsRed+/pSmad3+ and EGFP+/pSmad3+ cells, respectively. White arrows indicate cells that are DAPI+/pSmad3+ but DsRed− and EGFP−. Dotted lines indicate the wound edge. (B) Percentage of Tgfβ activity quantified in ccn2a+/+ and ccn2a−/− hearts (n=4). The graph represents the ratio of nuclear DsRed+/pSmad3+ CMs to the total number of nuclear DsRed+ CMs in the border zone (CMs); the ratio of EGFP+/pSmad3+ cells to the total number of EGFP+ endocardial/endothelial cells in the injured tissue (ECs); and the ratio of pSmad3+/DAPI+ cells to the total number of EGFP- and DsRed- cells per unit area in the injured tissue (non-CMs and non-ECs). The mean wild-type control value was set to 100%. Quantifications were performed on two sagittal sections from each heart. (C) Percentage of Tgfβ activity quantified in ccn2a+/+, ccn2a+/− and ccn2a−/− hearts at 4 dpci (n=3). The graph represents the ratio of pSmad3+/DAPI+ nuclei to the total number DAPI+ nuclei in the injured tissue. The mean wild-type control value was set to 100%. Quantifications were performed on two sagittal sections from each heart. (D) qPCR analysis of serpine1 and mixl1 expression at 4 dpci (n=3, each sample is a pool of six hearts). (E) Maximum intensity projection of confocal images of sagittal cryosection through 4 dpci wild-type and ccn2a-overexpressing (hsp70:ctgfa) heart expressing DsRed in CM nuclei (magenta), immunostained for pSmad3 (yellow) and stained with DAPI (white; marks all nuclei). Arrowheads indicate pSmad3+/DAPI+ cells. Dotted lines indicate the wound edge. (F) Nuclear pSmad3+ cells in the injured tissue quantified in wild-type and ccn2a-overexpressing (hsp70:ctgfa) heart (n=5 each). Two sagittal heart sections from each heart were considered for quantification. The mean wild-type control value was set to 100%. (G) qPCR analysis of serpine1 and mixl1 expression at 4 dpci (n=3, each sample is a pool of four hearts). (H) Schematic of the experimental procedures used in I and J. (I) Maximum intensity projection of optical sections of sagittal cryosections through 4 dpci wild-type heart and DMSO or SB431542 treated ccn2a-overexpressing (hsp70:ctgfa) heart, immunostained for pSmad3 (magenta) and with MF20 (cyan), and stained with DAPI (white; marks all nuclei). Arrowheads indicate pSmad3+/DAPI+ cells. Dotted lines indicate the wound edge. (J) Percentage of Tgfβ activity quantified in wild-type, and in DMSO or SB431542-treated ccn2a-overexpressing hearts at 4 dpci (n=4). The graph represents the ratio of pSmad3+/DAPI+ nuclei to the total number DAPI+ nuclei in the injured tissue. The mean wild-type control value was set to 100%. Quantifications were performed on two sagittal sections from each heart. Data are mean±s.d. A two-tailed Student's t-test was used to evaluate the statistical significance of the differences (GraphPad Prism). Thickness of the each maximum projection is 10-12 µm. Mean Ct values are provided in Table S4.