
|
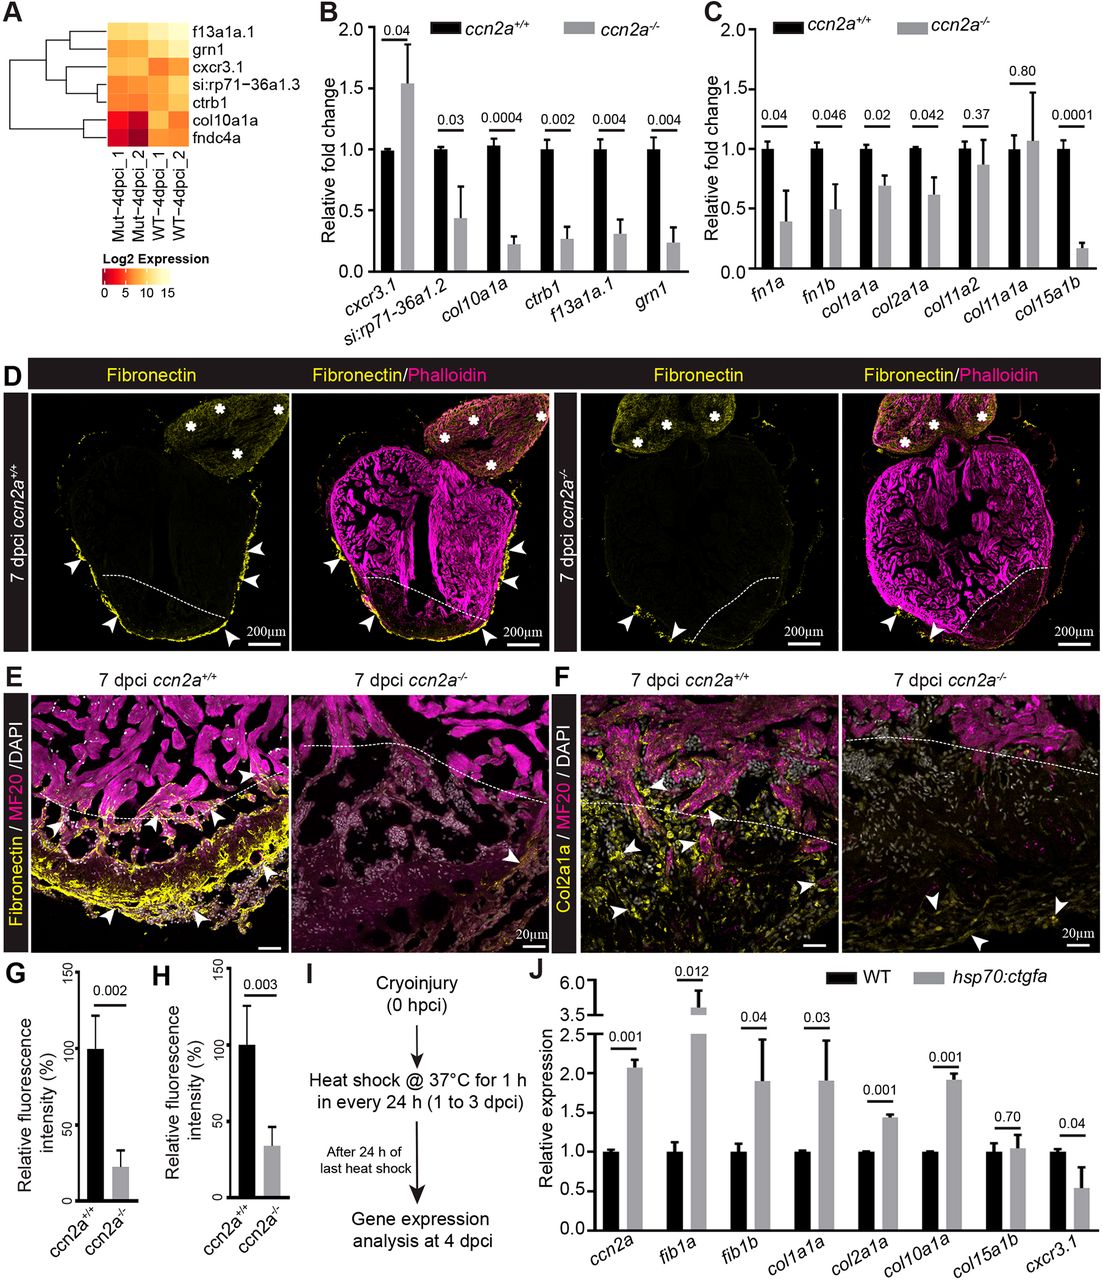
Fig. 6 Ccn2a regulates secreted protein gene expression in injured heart. (A) Heat map with color key showing changes in gene expression between ccn2a mutant (Mut) and wild-type (WT) hearts at 4 dpci based on RNA-sequencing analysis. (B) qPCR analysis to validate the RNA sequencing data (A) at 4 dpci (n=3, each sample is a pool of 6 hearts). (C) Quantification of fibronectin and collagen gene expression at 4 dpci (n=3, each sample is a pool of 6 hearts). (D) Sagittal cryosections of 7 dpci heart immunostained for fibronectin (yellow) and stained for F-actin (phalloidin; marks all cells). Arrows and asterisks indicate fibronectin localization in the ventricle and bulbus arteriosus, respectively. (E) Fibronectin and MF20 immunohistochemical staining of ventricular sagittal cryosection of 7 dpci heart. Arrowheads indicate fibronectin localization in the injured tissue. (F) Col2a1a and MF20 immunohistochemical staining of a ventricular sagittal cryosection of 7 dpci heart. Arrowheads indicate Col2a1a localization in the injured tissue. Dotted lines mark the injury border. (G,H) Quantification of the percent relative fluorescence intensity of fibronectin (G) and Col2a1a (H) in wild-type and ccn2a−/− heart sections (n=4). The heart section from each heart showing the highest fluorescence intensity for fibronectin or Col2a1a was considered for analysis, and the mean of the wild-type control value was set to 100%. (I) Schematic of the experimental protocol used to measure gene expression post-cryoinjury in wild-type and hsp70:ctgfa transgenic animals. After cryoinjury, animals were subjected to daily 1 h heat shocks for 3 days. RNA was isolated 24 h after the last heat shock. (J) Quantitative analysis of the expression of fib1a, fib1b, col1a1a, col2a1a, col10, col15a1b and cxcr3.1 in injured wild-type and ccn2a overexpressing (hsp70:ctgfa) hearts at 4 dpci (n=3, each sample represents a pool of six hearts). Data are mean±s.d. Values in B,C and J are normalized to the mean of the control. The statistical significance of differences was evaluated using a two-tailed Student's t-test (GraphPad Prism). The thickness of each maximum projection is 10-12 µm. Mean Ct values for this figure are provided in Table S4.