IMAGE

Figure 5

ID
ZDB-IMAGE-210228-18
Source
Figures for Clark et al., 2021
Image
Figure Caption

Figure 5

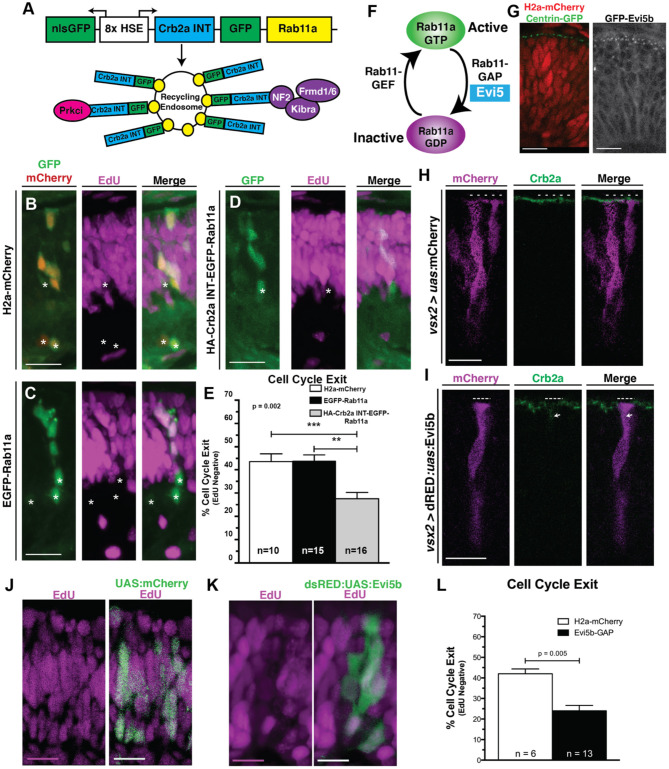
Crb2aINT localized to Rab11a recycling endosomes and inhibition of recycling endosome activity promote RPC proliferation. (A) Schematic of the heat-shock inducible transgene to localize the Crb2aINT to EGFP-Rab11a positive recycling endosomes. (B–D) Images assessing cell cycle exit (EdU negative) within clones of (B) Control (nlsGFP; H2a-mCherry). (C) EGFP-Rab11a overexpression (nlsGFP; EGFP-Rab11a) or (D) Crb2aINT localized to Rab11a-positive recycling endosomes (nlsGFP; Crb2aINT-GFP-Rab11a). Transgene expression is induced through heat-shock at 24 hpf, with EdU pulse from 36 to 48 hpf. (E) Quantification of average cell cycle exit across clones. Graph represents mean percentages of cell cycle exit across clones with error bars indicating SEM. Listed n-values represent number of quantified embryos within each genotype. Statistics are the result of a One-way ANOVA (p = 0.002) followed by a Tukey's multiple comparisons test. ***p < 0.001; **p < 0.01. (F) Schematic of the molecular switching of Rab11a from the GTP-bound active form to the GDP-bound inactive form. Hydrolysis of Rab11a-GTP to Rab11a-GDP is mediated by the Rab11a-GAP, Evi5. (G) Comparisons of centrosome localization (Centrin-GFP; left) to transgenic expression of a GFP-tagged Evi5b (right) in 28 hpf RPCs. Both transgenes localize in apical puncta, suggesting conserved localization of Evi5b to peri-centrosome regions within the developing zebrafish retina. (H,I) Representative (n > 5 embryos/genotype) immunostaining assessing Crb2a localization within 32 hpf RPCs after transgenic expression of either (H) Control (mCherry) or (I) Evi5b transgenes. Dotted lines in (H,I) indicate apical domains of transgenic cells, including regions where Crb2a staining is lost at the apical surface in Evi5b transgenic cells in I. Arrow in I indicates non-apical localization of Crb2a. (J,K) Assessment of cell-cycle exit through incorporation of EdU after a 12-h pulse from 36 to 48 hpf in (J) Control (UAS:mCherry) or (K) Evi5b transgenic clones, with transgene expression driven from by vsx2:Gal4 expression in RPCs. (L) Quantification of average cell-cycle exit (Edu-negative cells; 12 h pulse from 36 to 48 hpf) within transgenic clones of 48 hpf retinas. N's represent number of clones assayed from >4 animals/genotype. Bar graph in (L) represent the means with SEM, with statistics indicating the results of an unpaired Student's t-test. Scale bars represent 25 μm. * in B–D indicates cells counted as having exited the cell cycle (EdU negative).

Acknowledgments
This image is the copyrighted work of the attributed author or publisher, and ZFIN has permission only to display this image to its users. Additional permissions should be obtained from the applicable author or publisher of the image. Full text @ Front Cell Dev Biol