IMAGE

Figure 2

ID
ZDB-IMAGE-210228-15
Source
Figures for Clark et al., 2021
Image
Figure Caption

Figure 2

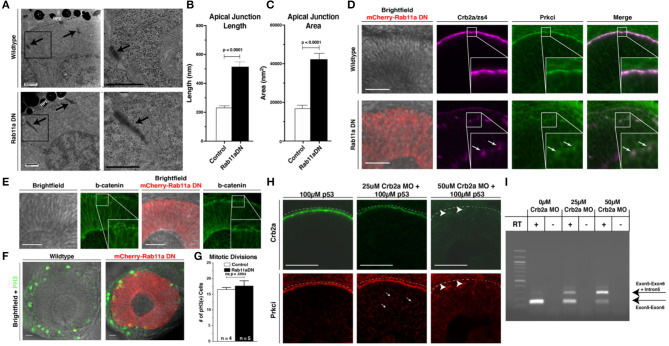
Rab11aDN expression causes Crb2a and Prkci mis-localization, but maintenance of additional features of apical-basal polarity. (A) Electron microscopy images of cells from 34 hpf Control (top panels) and Rab11aDN (bottom panels) retinas. Images are orientated at the apical surface, at the interface of the RPCs and Retinal Pigmented Epithelial (RPE) cells. Apical tight junctions are indicated by the black arrows. Black boxes (left panels) indicate higher magnification regions highlighted in the right panels. Scale bars = 500 nm. (B,C) Quantification of apical junction (B) length and (C) area from 34 hpf TEM images of Control and Rab11aDN-expressing RPCs. (D) Localization of Crb2a and Prkci within 28 hpf Control (top) and Rab11aDN (bottom) retinas. High magnification insets are outlined in the white squares. Arrows indicate ectopic localization of Crb2a and Prkci in Rab11aDN retinas. (E) Maintenance of the adherens junction protein ß-catenin localization in 28 hpf Control (left panels) and Rab11aDN (right panels) retinas. White squares indicate the regions of magnified insets. (F) Localization of mitoses as labeled by PH3 in Control (left) and Rab11aDN (right) retinas. (G) Quantification of the number of cells undergoing mitosis across the entire retina of 28 hpf Control and Rab11aDN retinas. Indicated n's represent total number of retinas quantified (1 retina/embryo). (H) Titration experiment of crb2a morpholino assessing the dosage-dependence of morpholino injection on Crb2a expression and Prkci localization. Increasing amounts of crb2a morpholino result in reduced Crb2a immunostaining and decreased accumulation of Prkci at the apical surface. Arrows indicate sites on non-apical Prkci localization in crb2a morphants, and arrowheads represent remaining Crb2a immunostaining accompanied by apical localization of Prkci staining. Dotted lines are positioned just above the apical surface (interface of RPE and progenitor cells). (I) Agarose gel of resulting PCR bands from RT-PCRs assessing efficiency of the splice-blocking crb2a morpholino within titration experiments. RT indicates the presence or absence of reverse transcriptase during cDNA synthesis. Arrows indicate the expect size of PCR products for the crb2a Exon5-6 junction (lower arrow) or across the crb2a Exon5-6 junction and including the crb2a intron 5. Scale bars in (D–F,H) represent 50 μm. Bar graphs represent mean values with error bars indicating standard error. Apical junction length and area (B,C) were quantified across 12 cells for each genotype, from 4 embryos/genotype. P-values represent statistical results of an unpaired t-test.

Acknowledgments
This image is the copyrighted work of the attributed author or publisher, and ZFIN has permission only to display this image to its users. Additional permissions should be obtained from the applicable author or publisher of the image. Full text @ Front Cell Dev Biol