
|
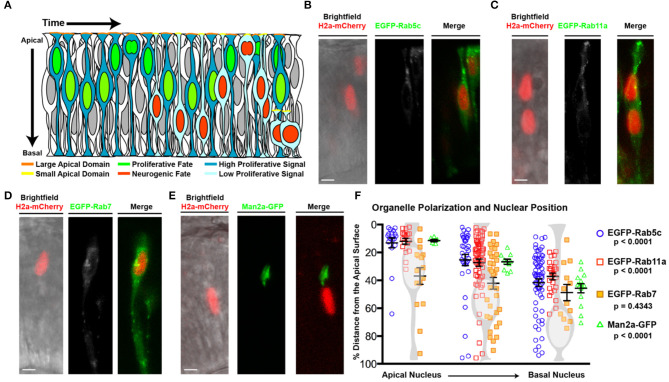
Figure 1 Organelle positioning during interkinetic nuclear migration. (A) Schematic of cellular features correlated with neurogenic and proliferative RPCs, including nuclear position, apical domain size, and proliferative signaling. (B–E) Examples of genetic mosaics of transplanted cells with H2a-mCherry labeled nuclei and endocytic organelles marked by EGFP-fusion proteins. (B) Early endosome (EGFP-Rab5c) localization in cells with apical nuclei. (C) Recycling endosome (EGFP-Rab11a) localization. (D) Late endosome (EGFP-Rab7) localization, and (E) localization of the medial Golgi apparatus (Man2a-GFP). (F) Quantification of the distance of organelles from the apical surface when nuclei are positioned apically (<25% of apical-basal distance), middle (25–50% of apical-basal distance), or basally (>50% of apical-basal distance). Data represent individual organelle positioning with mean and SEM indicated for each organelle type for each bin of nuclear positions from >10 cells/nuclear position bin from >5 embryos/genotype. Statistics represent results of a One-way ANOVA. Scale bars in (B–E) represent 10 μm.