IMAGE

FIGURE 2

ID
ZDB-IMAGE-210221-2
Source
Figures for Lahne et al., 2021
Image
Figure Caption

FIGURE 2

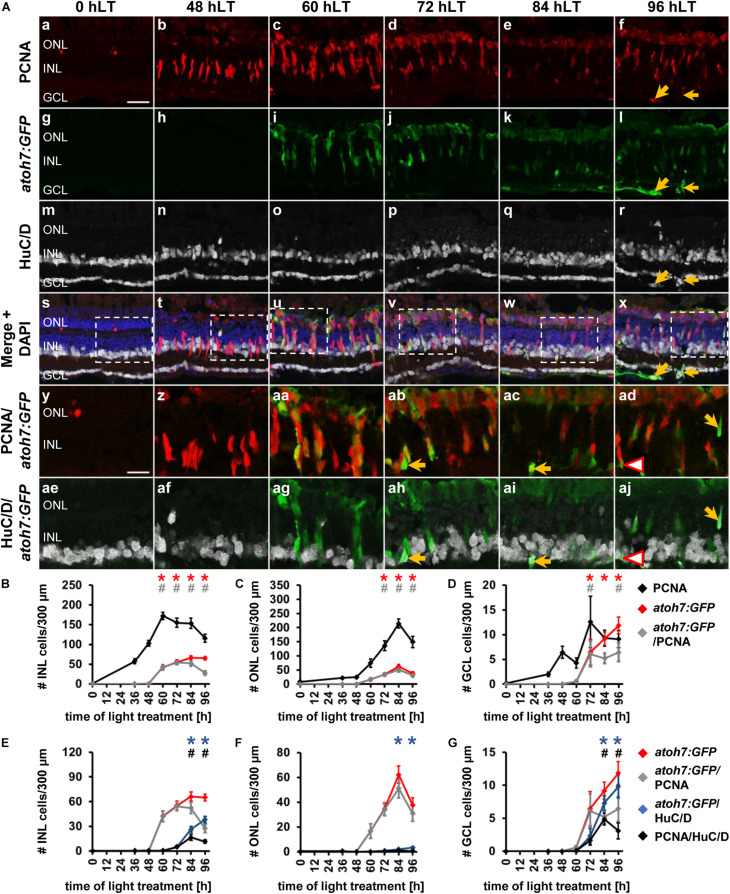
Ganglion cell competence factor atoh7 is upregulated in the light-damaged retina. (Aa–aj) Single z-plane confocal images of retinal sections from light-damaged Tg[atoh7:GFP]rw021 zebrafish (0, 48, 60, 72, 84, 96 hLT) immunolabeled for PCNA (Aa–f,As–ad), GFP (Ag–l,As–aj), HuC/D (Am–x,Aae–aj) and counterstained with DAPI (As–x). (Ay–aj) Regions outlined in panels (As–x) at higher magnification. Yellow arrows, atoh7:GFP, PCNA and HuC/D-triple positive cells. Red outlined arrowheads, atoh7:GFP and HuC/D-double positive cell that is PCNA-negative. Scale bars, 20 μm (Aa) and 10 μm (Ay). (B–D) Number of PCNA-positive, atoh7:GFP-positive and PCNA and atoh7:GFP-double positive cells in the INL (B), ONL (C), and GCL (D) over the light treatment timecourse. (E–G) Number of atoh7:GFP-positive cells and atoh7:GFP and PCNAdouble positive cells in comparison to atoh7:GFP and HuC/D-double positive and PCNA and HuC/D-double positive cells in the INL (E), ONL (F), and GCL (G) of retinas exposed to constant intense light for 0, 36, 48, 60, 72, 84, and 96 h. Mean ± SE, n ≥ 12, *pTukey < 0.05 and #p < 0.05 indicate comparisons to 0 hLT for the different measures that were assessed. The symbols are color-coded according to the line that they represent in the corresponding graphs (pANOVA, see Table 1). Significance was not determined for PCNA in panels (B–D) and symbols indicating significance for atoh7:GFP and atoh7:GFP and PCNA-double-positive cells are not shown in panels (E–G), as they are indicated in panels (B–D). PCNA, Proliferating Cell Nuclear Antigen.

Acknowledgments
This image is the copyrighted work of the attributed author or publisher, and ZFIN has permission only to display this image to its users. Additional permissions should be obtained from the applicable author or publisher of the image. Full text @ Front Cell Dev Biol