Figure Caption
FIGURE 8
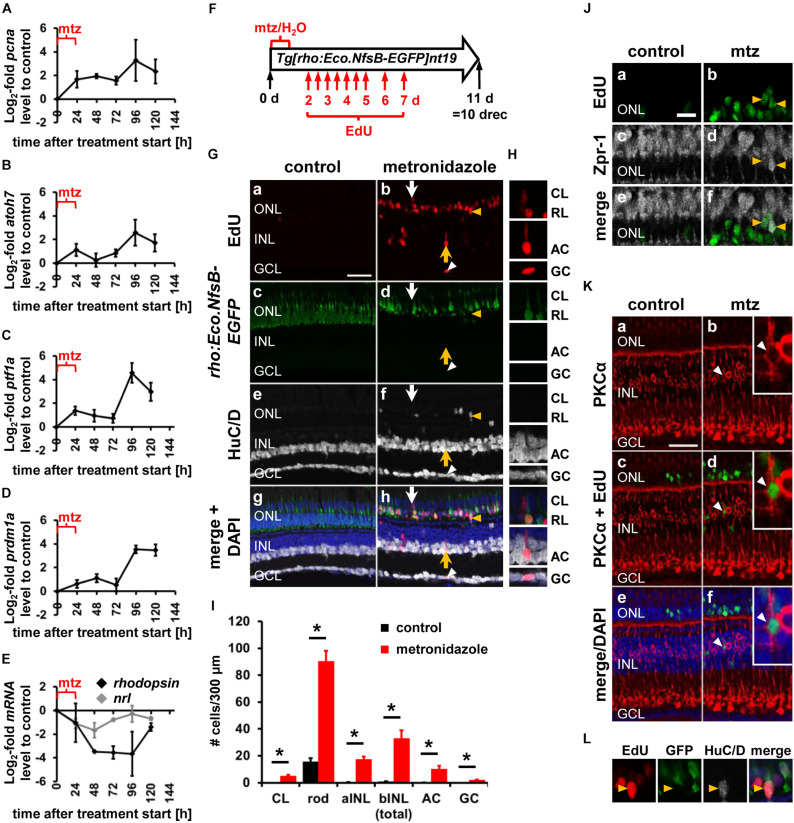
Expression of developmental competence factors and generation of all neuronal cell types following rod photoreceptor cell death in a genetic ablation model. (A–E) Line plots displaying mRNA expression levels expressed as log2-fold changes relative to 0 h controls for pcna(A), atoh7(B), ptf1a(C), prdm1a(D), nrl (E, gray line), and rhodopsin (E, black line) following metronidazole-induced rod photoreceptor cell death in Tg[rho:Eco.NfsB-EGFP]nt19 zebrafish (24, 48, 72, 96, and 120 h after metronidazole treatment onset). Mean ± SE, n ≥ 3. (F) Schematic of the experimental paradigm: Tg[rho:Eco.NfsB-EGFP]nt19 zebrafish were either exposed to metronidazole (mtz) or system water (H2O) for 24 h and subsequently recovered in system water for 10 days (10 drec). Intraperitoneal EdU injections at the indicated timepoints (red arrows). (Ga–h,H,L) Single z-plane confocal images of retinal sections from metronidazole or water-exposed EdU-injected Tg[rho:Eco.NfsB-EGFP]nt19 zebrafish (Ga,b,g,h) at 10 drec that were labeled for GFP (Gc,d,g,h), HuC/D (Ge–h), and DAPI (Gg,h). Arrowhead, GCL EdU-positive ganglion/amacrine cell; yellow arrow, INL EdU-positive amacrine cell; white arrow, EdU-positive cell in the cone nuclear layer. Scale bar, 20 μm (Ga). (H) EdU-positive cells in panel (Ab) (arrows, white arrowhead) at higher magnification. (I) Number of EdU-positive cells in the cone nuclear layer, apical and basal INL and those identified as rod photoreceptor cells by co-labeling with rho:Eco.NfsB-EGFP, as amacrine and ganglion cells based on the expression of HuC/D in the basal INL or GCL, respectively, at 10 drec following exposure of Tg[rho:Eco.NfsB-EGFP]nt19 zebrafish to either system water (control) or metronidazole for 24 h. Mean ± SE, n ≥ 9, Student’s t-test, p < 0.05. (J,K) Single z-plane confocal images from water or metronidazole-exposed EdU-injected (Ja,b,e,f,Kc–f)Tg[rho:Eco.NfsB-EGFP]nt19 zebrafish at 10 drec that were labeled for Zpr-1 (Jc–f) or PKCα (Ka–f) and counterstained with DAPI (Ke,f). Yellow arrowheads (J), Zpr-1 & EdU-double positive cells; white arrowhead (K), PKCα & EdU-positive cell. (L) EdU & HuC/D-double positive ONL cell (yellow arrowhead) in panel (G) at higher magnification. aINL, apical inner nuclear layer; bINL, basal inner nuclear layer; CL, cone nuclear layer; RL, rod nuclear layer; mtz, metronidazole.
Acknowledgments
This image is the copyrighted work of the attributed author or publisher, and
ZFIN has permission only to display this image to its users.
Additional permissions should be obtained from the applicable author or publisher of the image.
Full text @ Front Cell Dev Biol