
|
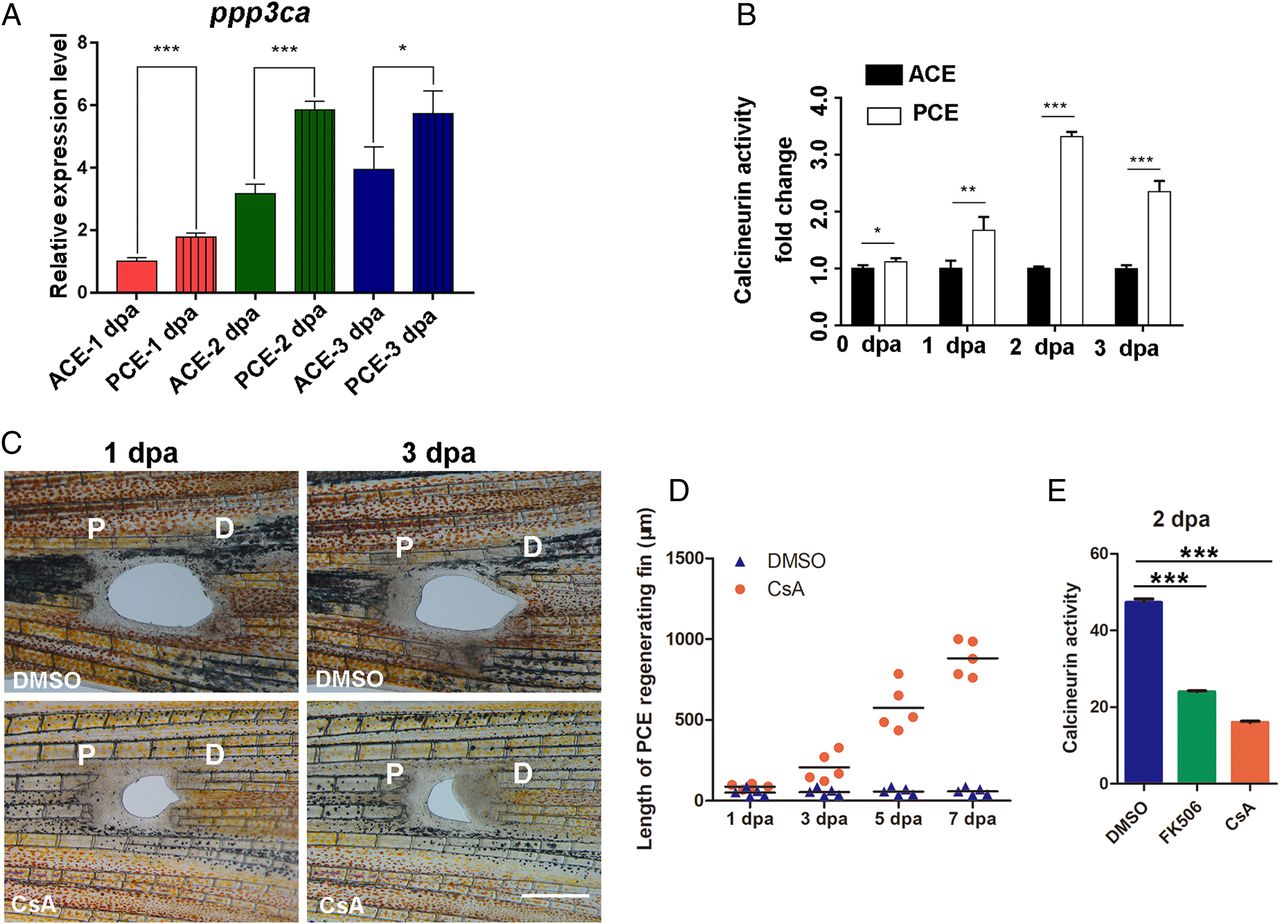
Fig. 5 Obvious differences in calcineurin activity between the PCE and ACE. (A) The qRT-PCR analysis revealed that the ppp3ca expression of the PCE was higher than ACE (Student’s t test, *P < 0.05, ***P < 0.001). (B) Differences in calcineurin activity differences between the PCE and ACE at 0, 1, 2, and 3 dpa (Student’s t test, *P < 0.05, **P < 0.01, ***P < 0.001). Data are presented as mean ± SD. (C) PCE regeneration was induced by CsA treatment (n = 5/10) compared with DMSO treatment (n = 7/10). (D) Quantification of fin regenerative tissue lengths (in micrometers) of the PCE after FK506 or CsA treatment (n = 5). (E) Calcineurin activities of the PCE after FK506 or CsA treatment (n = 7, ***P < 0.001). P, proximal; D, distal. Data are presented as mean ± SD. (Scale bars: 500 µM.)