
Fig. 3
|
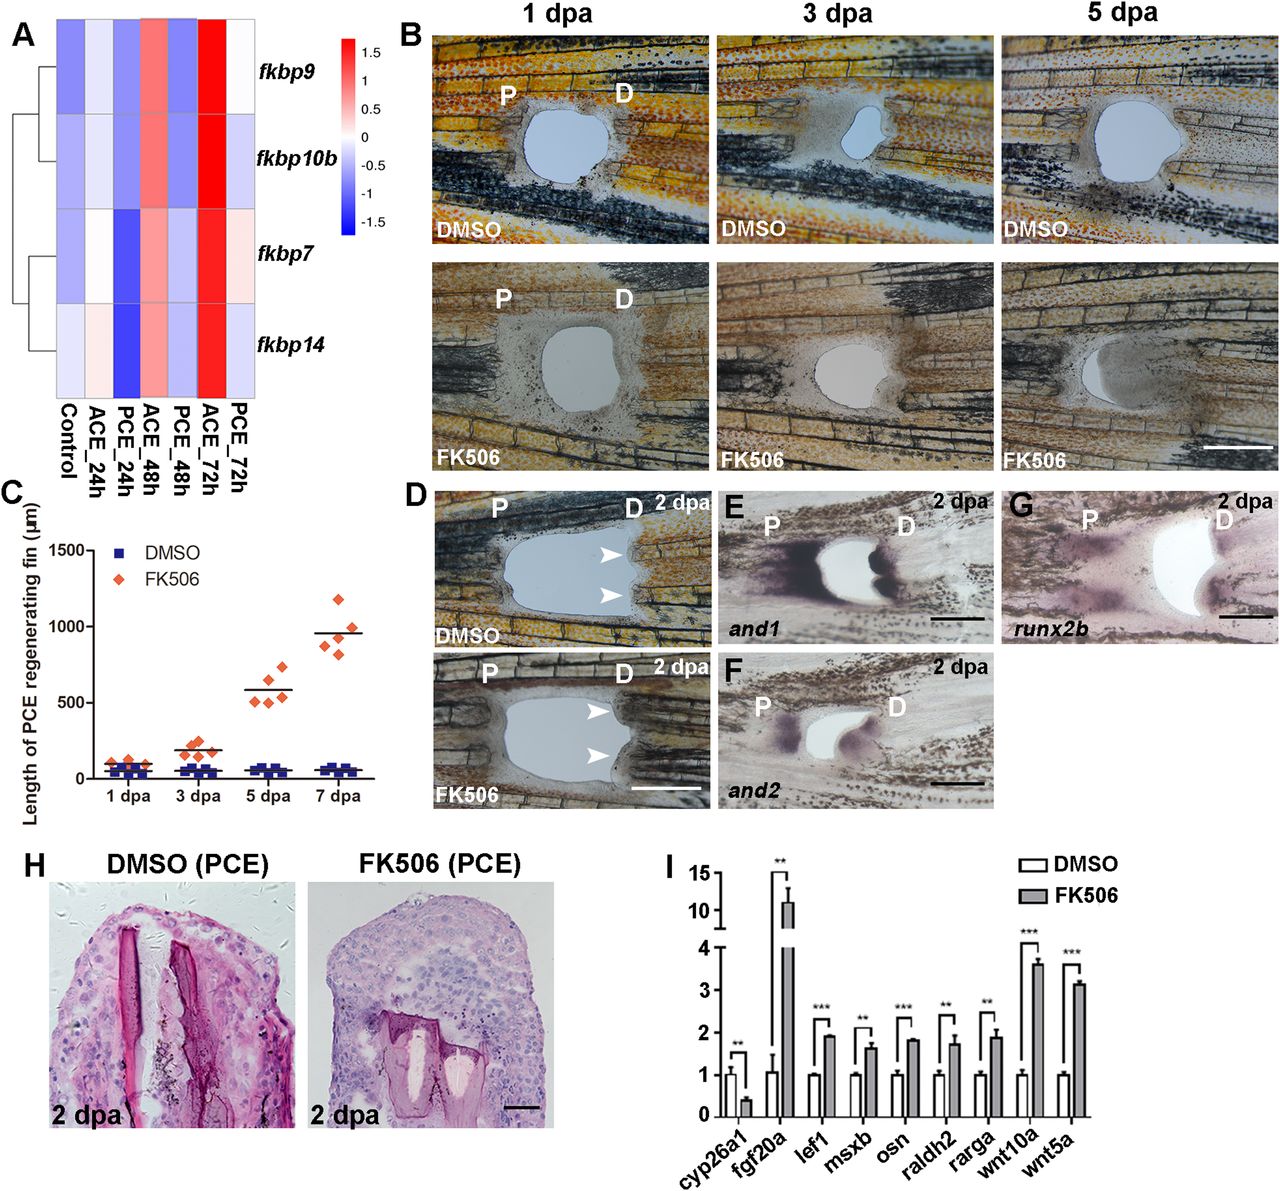
Fig. 3 PCE blastemas are induced by calcineurin inhibition. (A) RNA-Seq course analysis of the ACE and PCE and the heat map of fragments per kilobase million (FPKM) values of the indicated genes. (B) Regenerative fins at 1, 3, and 5 dpa after dimethyl sulfoxide (DMSO) (n = 7/8) or FK506 treatment (n = 5/10). (C) Quantification of fin regenerative tissue lengths of the PCE (in micrometers) (n = 5). (D) Regenerative blastemas (indicated by arrows) occurred in zebrafish fins after FK506 treatment (n = 5/12) compared with DMSO (9/10) at 2 dpa. (E–G) and1, and2, and runx2b were expressed in the PCE after the FK506 treatment at 2 dpa. (H) Histological analyses of the PCE after DMSO (7/8) or FK506 treatment (5/8). (I) qRT-PCR results comparing the differences between the relative expression of regeneration-associated genes for FK506 or DMSO-treated PCE (Student’s t test, **P < 0.01, ***P < 0.001). Data are presented as mean ± SD. P, proximal; D, distal. (Scale bars: 500 µM in B–G; 100 µM in H.)