
|
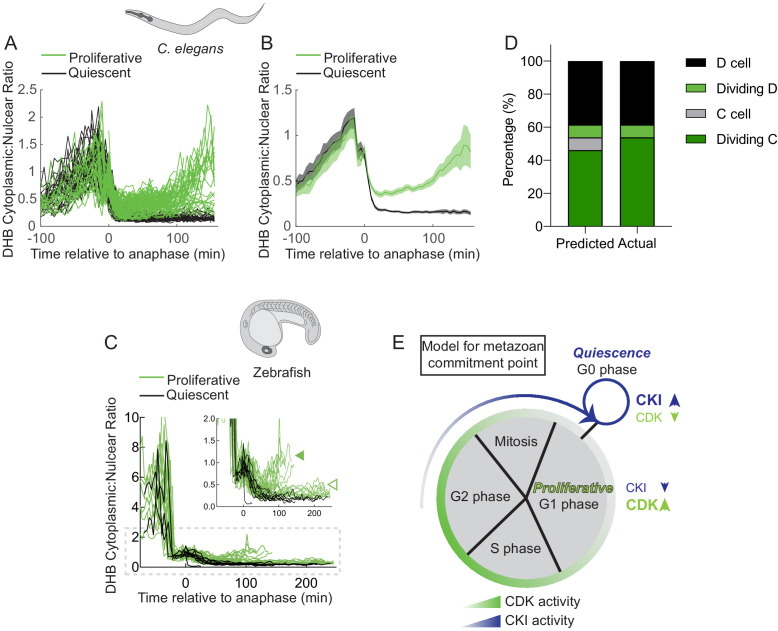
Figure 8—figure supplement 1. (A–D) Single-cell traces of CDK activity for all quantified C. elegans (A, B) and zebrafish (C) cell births for CDKinc cells (green) and CDKlow cells (black). DHB ratio of single-cell data (A, C) and mean ± 95% confidence intervals (B) are plotted for each cell analyzed relative to anaphase. A solid green arrowhead indicates a population of fast cycling CDKinc cells while the open green arrowhead indicates a population of CDKinc cells that may be slow cycling in an extended G1 phase. (E) A stacked bar graph of predicted vs. actual cell fates for the D, dividing D, C, and dividing C cells, based on a classifier trained on post-anaphase CDK activity in VPC trace data. (E) A model for the metazoan commitment point argues that the G1/G0 decision is influenced by a maternal input of CKI activity and that CDK activity shortly after mitotic exit can determine future cell fate.