
|
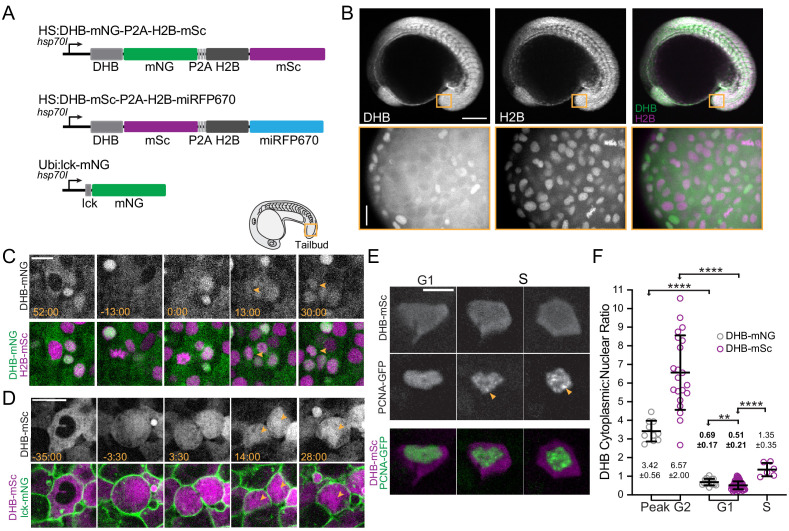
Figure 6 (A) Schematics of inducible zebrafish variants of the CDK sensor fused to mNG (top) or mSc (middle) and a nuclear mask (H2B-FP) separated by a self-cleaving peptide (P2A). Schematic of inducible membrane marker (lck-mNG; bottom). (B) Representative images of HS:DHB-mNG-P2A-H2B-mSC at 18 somites. Scale bar top row = 250 μm. (C, D) Frames of DHB time-lapses taken from the developing tailbud as designated by the orange box shown in the schematic. (E) DHB-mSC and PCNA-GFP puncta during S phase. (F) Dot plot of DHB ratios during interphase states (n ≥ 7 cells from ≥2 embryos). Insets, orange box, are zoom-ins. Scale bar = 20 μm. Line and error bars depict mean ± SD. Numbers in bold are tissues in G0. ns, not significant, **p≤0.01, ****p≤0.0001. Significance determined by statistical simulations; p-values in Supplementary file 1.