
|
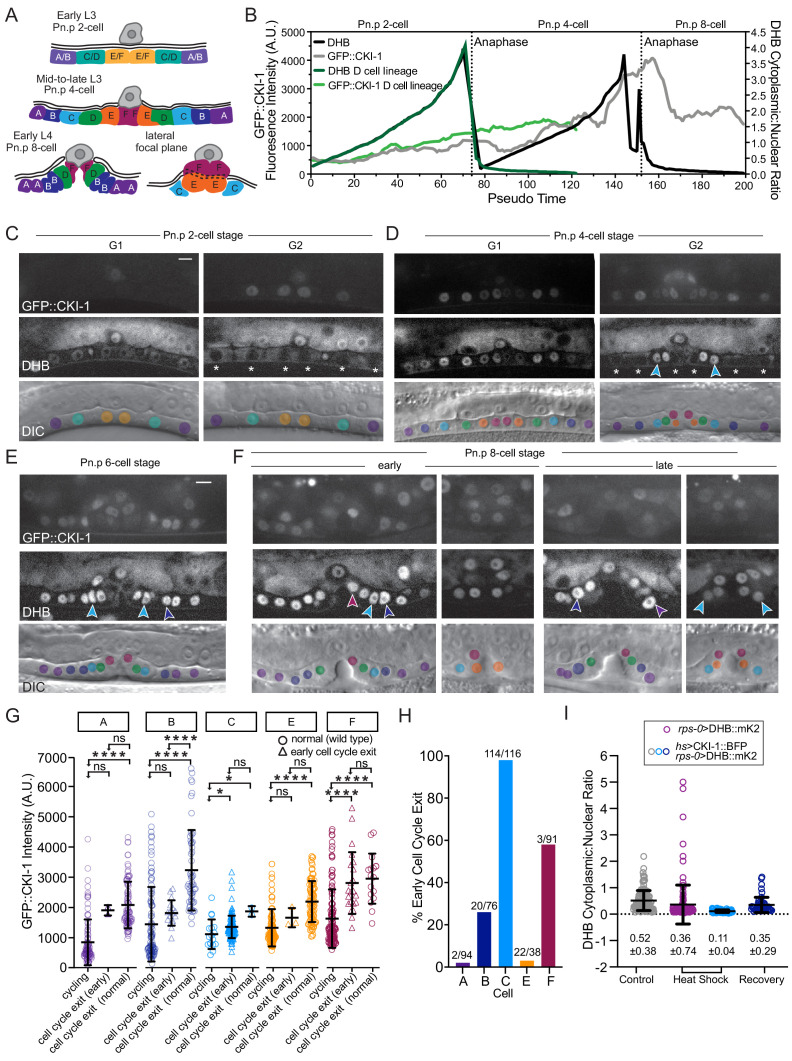
Figure 4 (A) Schematic of VPC divisions in the L3-L4 larval stage. (B) CDK activity and CKI-1 levels across pseudo-time and DHB ratios for all VPCs (black line) and D cells (dark green line). GFP::CKI-1 fluorescence in VPCs (gray line) and D cell (light green line); n ≥ 93 cells per lineage. (C) Representative images of VPCs at the Pn.p 2-cell stage at G1 and G2 (white asterisk). (D) Representative images of VPCs at the Pn.p 4-cell stage at G1 and G2; early quiescent C cells (cyan arrows) with low levels of GFP::CKI-1. (E, F) Representative images of VPCs at the Pn.p 6- cell stage (E) and 8-cell stage (F); arrows show early quiescent C (cyan) and B cell (dark blue), F cell (magenta), and A cell (purple). (G) GFP::CKI-1 fluorescence in each cell of the VPC lineage (n ≥ 16, except C normal and A early n = 2, E early n = 3). (H) Percentage of cells of each lineage that showed signs of early quiescence and did not undergo their final division. (I) Overexpression of CKI-1 via heat shock causes cells to pre-maturely enter and remain in G0 (n ≥ 36 cells per treatment). Scale bar = 10 μm. ns, not significant, *p≤0.05, ****p≤0.0001. Significance determined by statistical simulations; p-values in Supplementary file 1.