
|
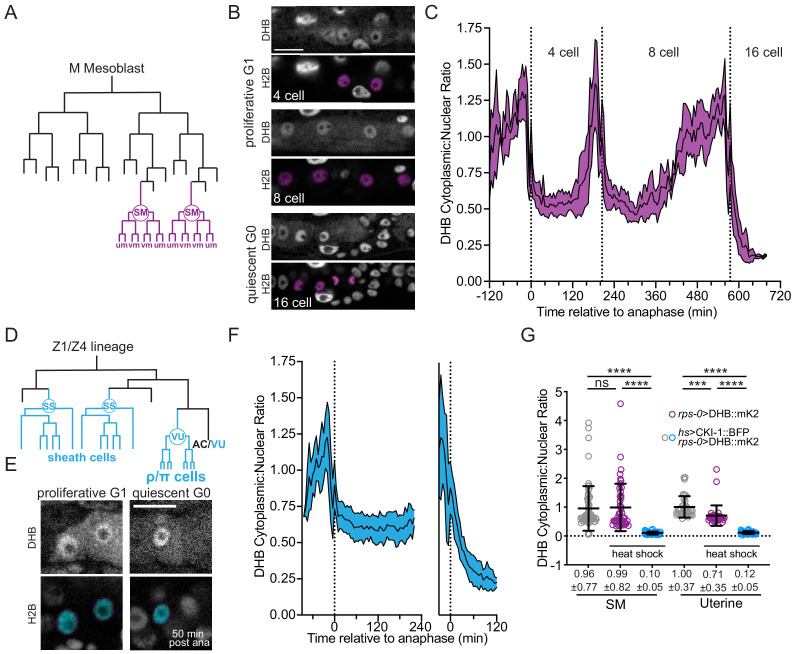
Figure 2 (A) SM lineage schematic. (B) Micrographs of a time-lapse showing SM cells at G1 and G0. (C) Quantification of CDK activity in SM cells (n ≥ 10). (D) Uterine lineage schematic. (E) Micrographs of a time-lapse showing uterine cells at G1 and G0. (F) Quantification of CDK activity in uterine cells (n ≥ 13). (G) Quantification of CDK activity in SM cells and uterine cells following ectopic expression of CKI-1 (hsp>CKI-1:: mTagBFP2) compared to non-heat shock controls and heat shock animals without the inducible transgene (n ≥ 36 cells per treatment). Pseudo-colored nuclei magenta, B; cyan, (E) indicate cells of interest. Scale bars = 10 μm. Dotted line in C and F indicates time of anaphase. Line and shaded error bands depict mean ± SD. Time series measured every 5 min. ns, not significant, ****p≤0.0001. Significance determined by statistical simulations; p-values in Supplementary file 1.