
|
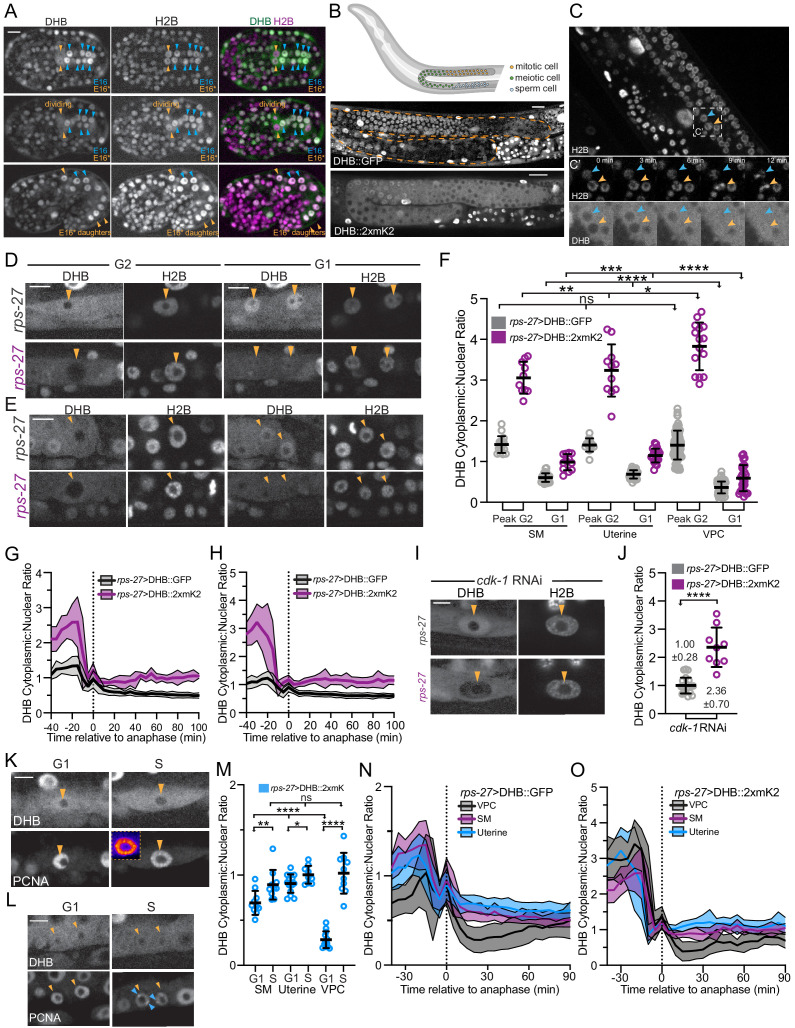
Figure 1—figure supplement 1. Related to Figure 1. (A) C. elegans embryos expressing the CDK sensor (rps-27>DHB::GFP::P2A::H2B::2xmKate2) at the intestinal E16/bean stage through the intestinal E20/1.5-fold stage. Twelve E16 cells arrest (blue arrows) and the remaining four E16* star cells (orange arrows) re-enter the cell cycle and go on to divide, giving rise to four anterior (one shown) and four posterior (two shown) daughters. All 20 intestinal cells remain arrested for the rest of embryonic development (n ≥ 14 embryos examined). Scale bar = 5 µm. (B) Cartoon (top) and representative micrographs of the late L4/young adult germline expressing DHB::GFP (middle, orange dashed line) and DHB::2xmKate2 (bottom). Scale bar = 10 µm. (C, C’) Representative micrograph and time series insets of H2B::GFP and DHB::2xmKate2 localization in a 12 min window, showing strong nuclear exclusion of DHB prior to mitosis in two representative germline nuclei (orange and cyan arrows; see Figure 1—video 1). Scale bar = 10 µm (C) and 5 µm (C’). (D, E) Representative images of sensor expression in sex myoblast cells (SMs; D) and uterine cells (E) at peak G2 and 20 min after anaphase during G1 in DHB::GFP (gray) and DHB::2xmKate2 (magenta). Orange arrowheads denote cells of interest. Scale bar = 5 µm. (F) Dot plot depicting dynamic ranges of the two CDK sensor variants, measured by the cytoplasmic:nuclear ratio of DHB signal, at G2 and G1 in the SMs, uterine cells and VPCs (n ≥ 10 cells for each lineage). Scale bar = 5 µm. (G, H) Plot of DHB ratios in SMs (G) and uterine cell (H) during one round of cell division, measured every 5 min (n ≥ 11 mother cells per strain). (I) Representative images of sensor expression in SMs following cdk-1 RNAi in DHB::GFP (gray) and DHB::2xmKate2 (magenta). (J) Dot plot depicting G2 DHB ratios of the two CDK sensor variants in SMs following cdk-1 RNAi (n ≥ 9 cells per strain). (K, L) Representative micrographs of DHB::2xmKate2 and PCNA (pcn-1>PCN-1::GFP) in SMs (K) and uterine cells (L) in G1 and S phase (inset highlights PCNA puncta in S phase in K and blue arrowheads denote PCNA puncta in L). Scale bar = 5 µm. (M) Dot plot depicting DHB::2xmKate2 ratios during G1 and S phase (n ≥ 9 cells per phase). (N, O) Plot of DHB ratios in DHB::GFP (N) and DHB::2xmKate2 (O) compared between post-embryonic lineages. Dotted line indicates time of anaphase. Error bars and shaded error bands depict mean ± SD. In all figure supplements: ns, not significant, *p≤0.05, **p≤0.01, ***p≤0.001, ****p≤0.0001. Significance determined by statistical simulations; p-values in Supplementary file 1.