
Image
|
Figure Caption
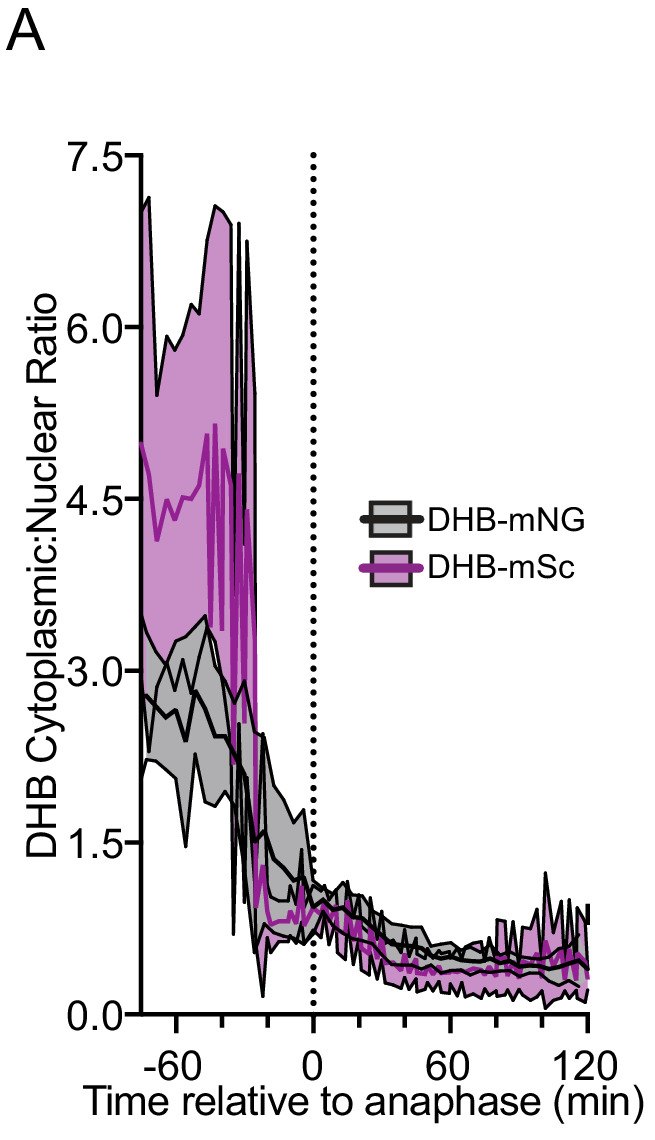
Figure 6—figure supplement 1. Related to Figure 6. (A) DHB ratio plot from time-lapse of DHB-mNG (gray) and DHB-mSc (magenta) of peak G2 through anaphase and G1 (n> 10 examined for each). Dotted line indicates time of anaphase.
Acknowledgments
This image is the copyrighted work of the attributed author or publisher, and
ZFIN has permission only to display this image to its users.
Additional permissions should be obtained from the applicable author or publisher of the image.
Full text @ Elife