
|
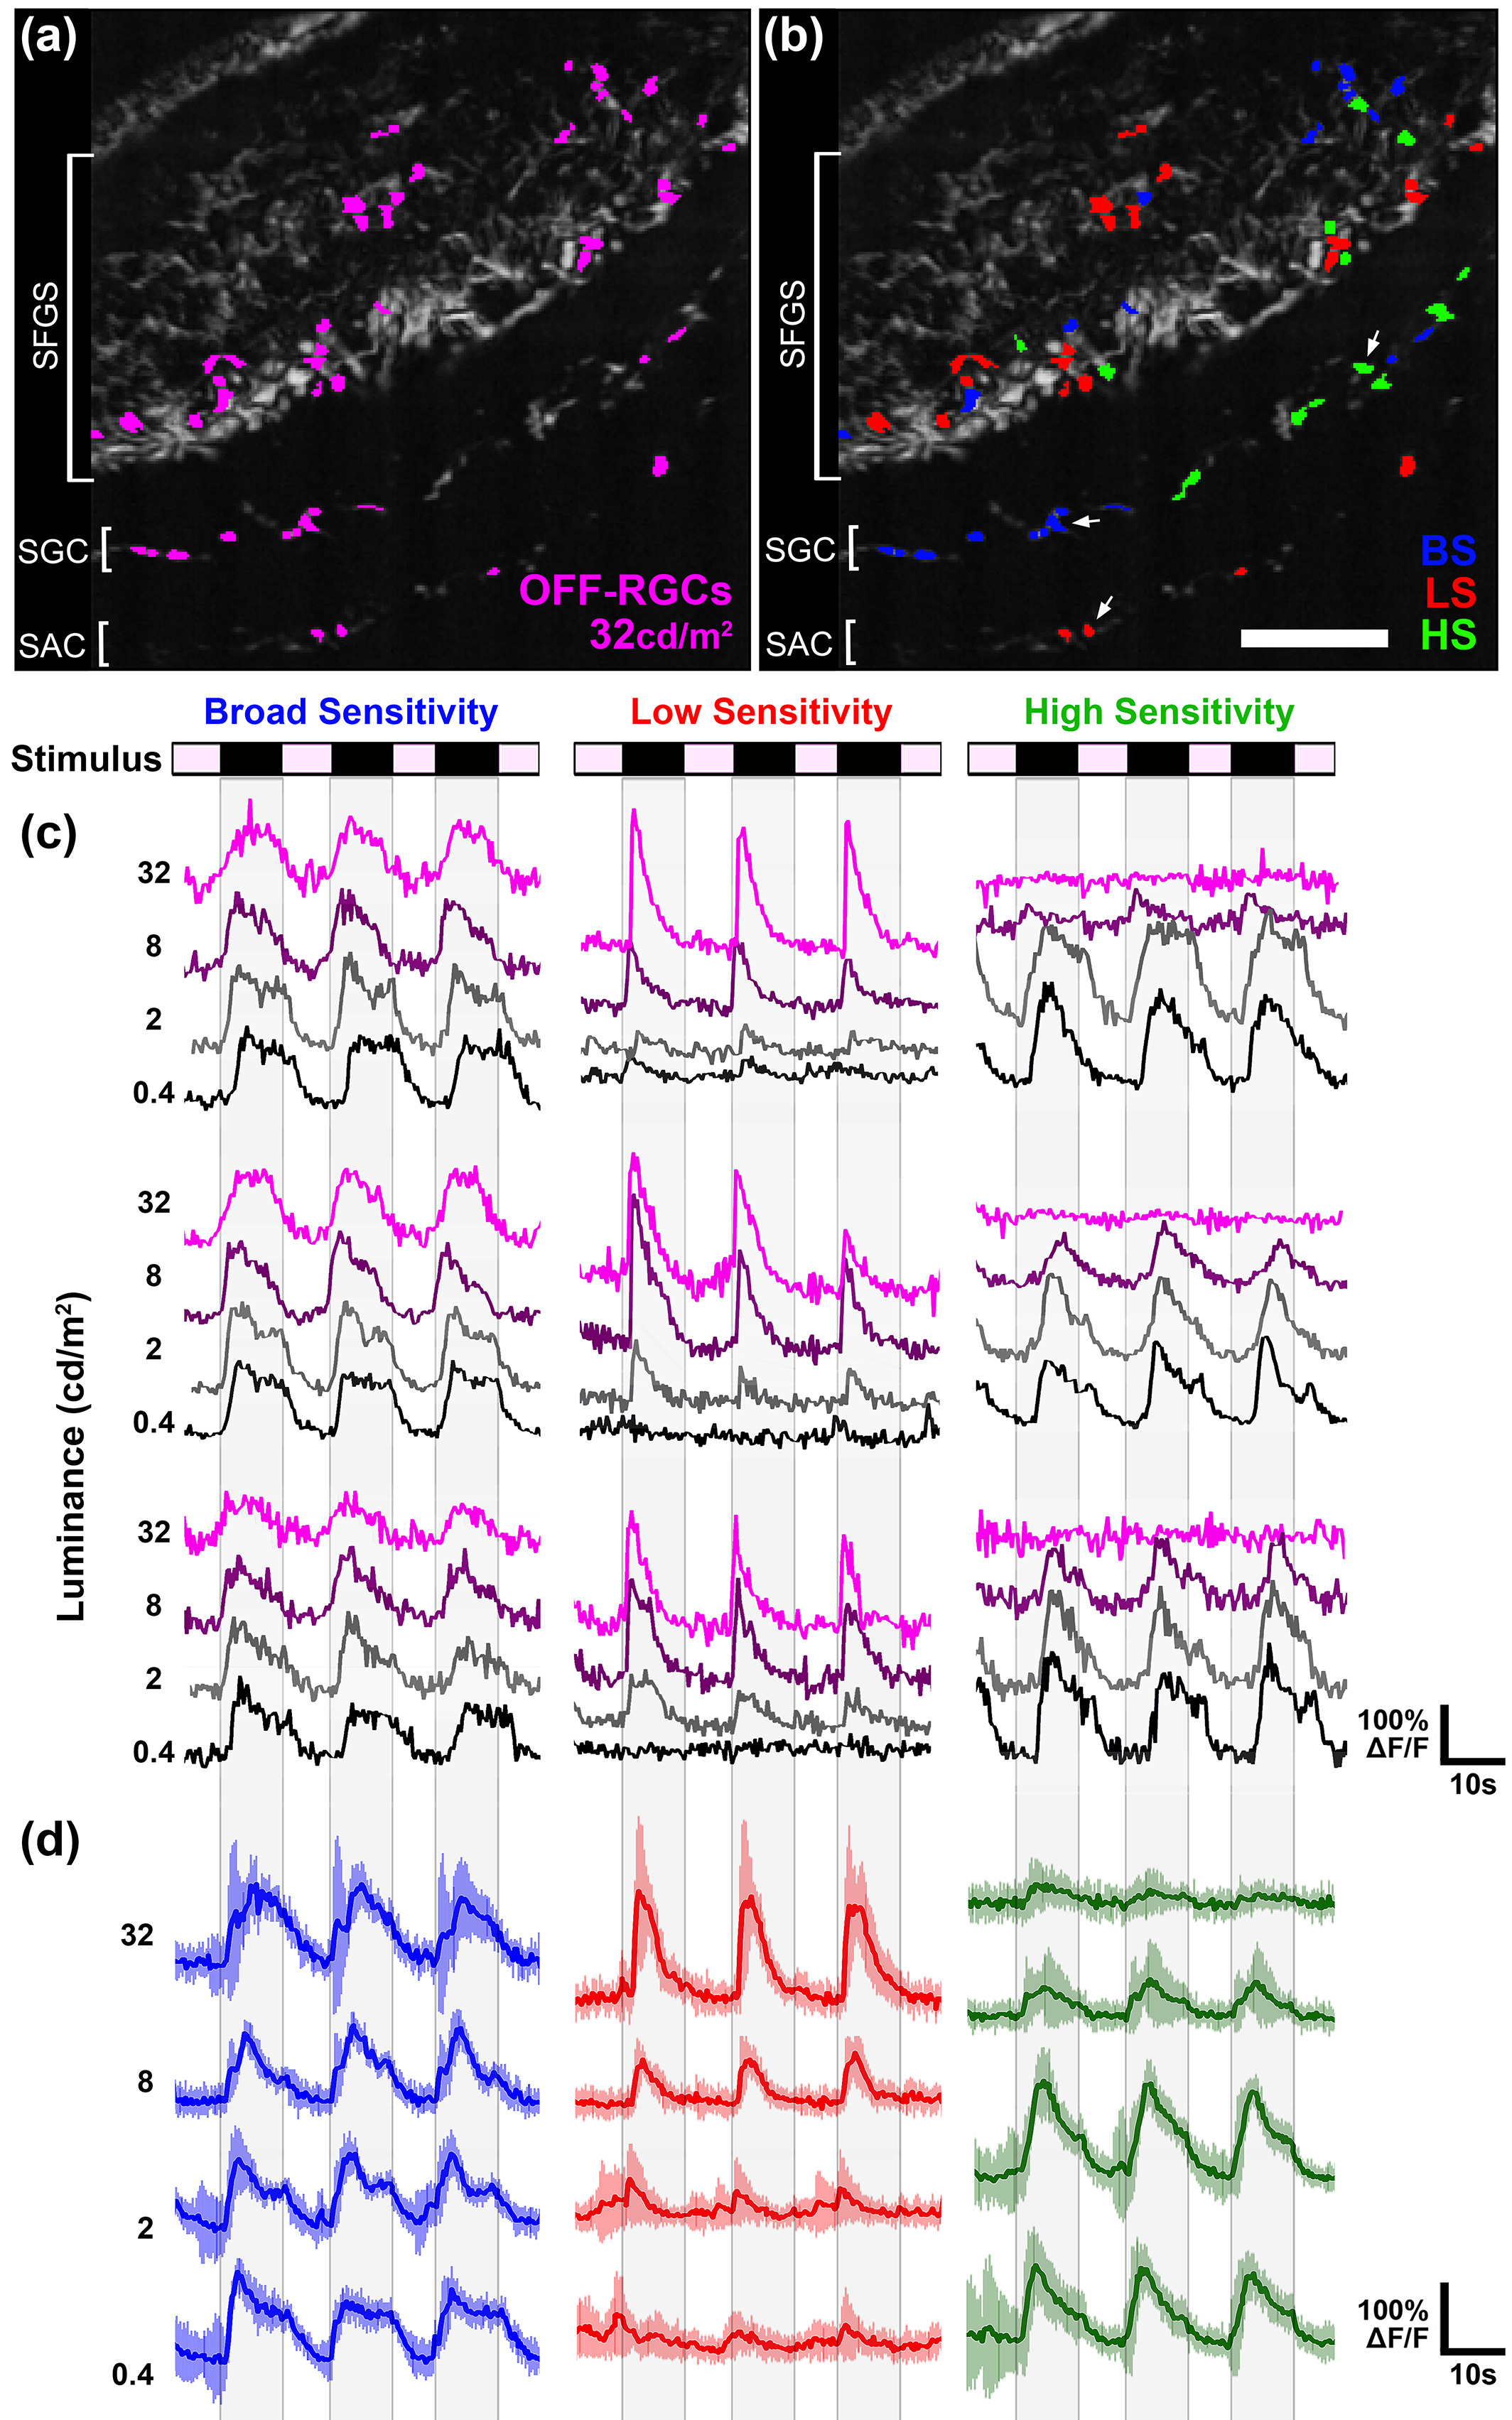
Fig. 4 OFF retinal ganglion cells (OFF‐RGCs) are comprised of functional classes with different photosensitivity profiles. (a) Average intensity projection from the left tectum of a 6 dpf Tg(atoh7:gal4,uas:gcamp6s) larva during presentation of 32 cd/m2 dimming stimulus to the right eye. Dimming detector regions of interest (ROIs) identified by cross‐correlation based image segmentation are shown in magenta. (b) Image in (a) with ROI color coding that indicates photosensitivity profile of individual OFF‐RGC terminals. BS (broad sensitivity) ROIs in blue correspond to OFF‐RGC terminals that responded strongly to trials at all stimulus intensities (0.4, 2, 8, and 32 cd/m2). LS (low sensitivity) ROIs in red correspond to OFF‐RGC terminals that responded optimally to trials with high light intensities during the ON phase (>8 cd/m2). HS (high sensitivity) ROIs in green correspond to OFF‐RGC terminals that responded optimally to trials with low light intensities during the ON phase (>8 cd/m2). (c) Sample traces of individual BS, LS, and HS OFF‐RGC terminals in tectum shown in (a and b). Each trace is 58 s in duration and consists of four ON phases of 7‐s duration interleaved with three OFF phases of 10‐s duration. The BS OFF‐RGC responds robustly at all stimulus intensities. In contrast, the LS OFF‐RGC did not respond at low light intensities, whereas the HS OFF‐RGC did not respond at high light intensities. (d) Average intensity traces of BS, LS, and HS OFF‐RGC terminals in the tectum shown in (a and b) (n = 11 ROIs for each group). Error bars represent SD. Scale bar: 20 μm in (a and b)