
|
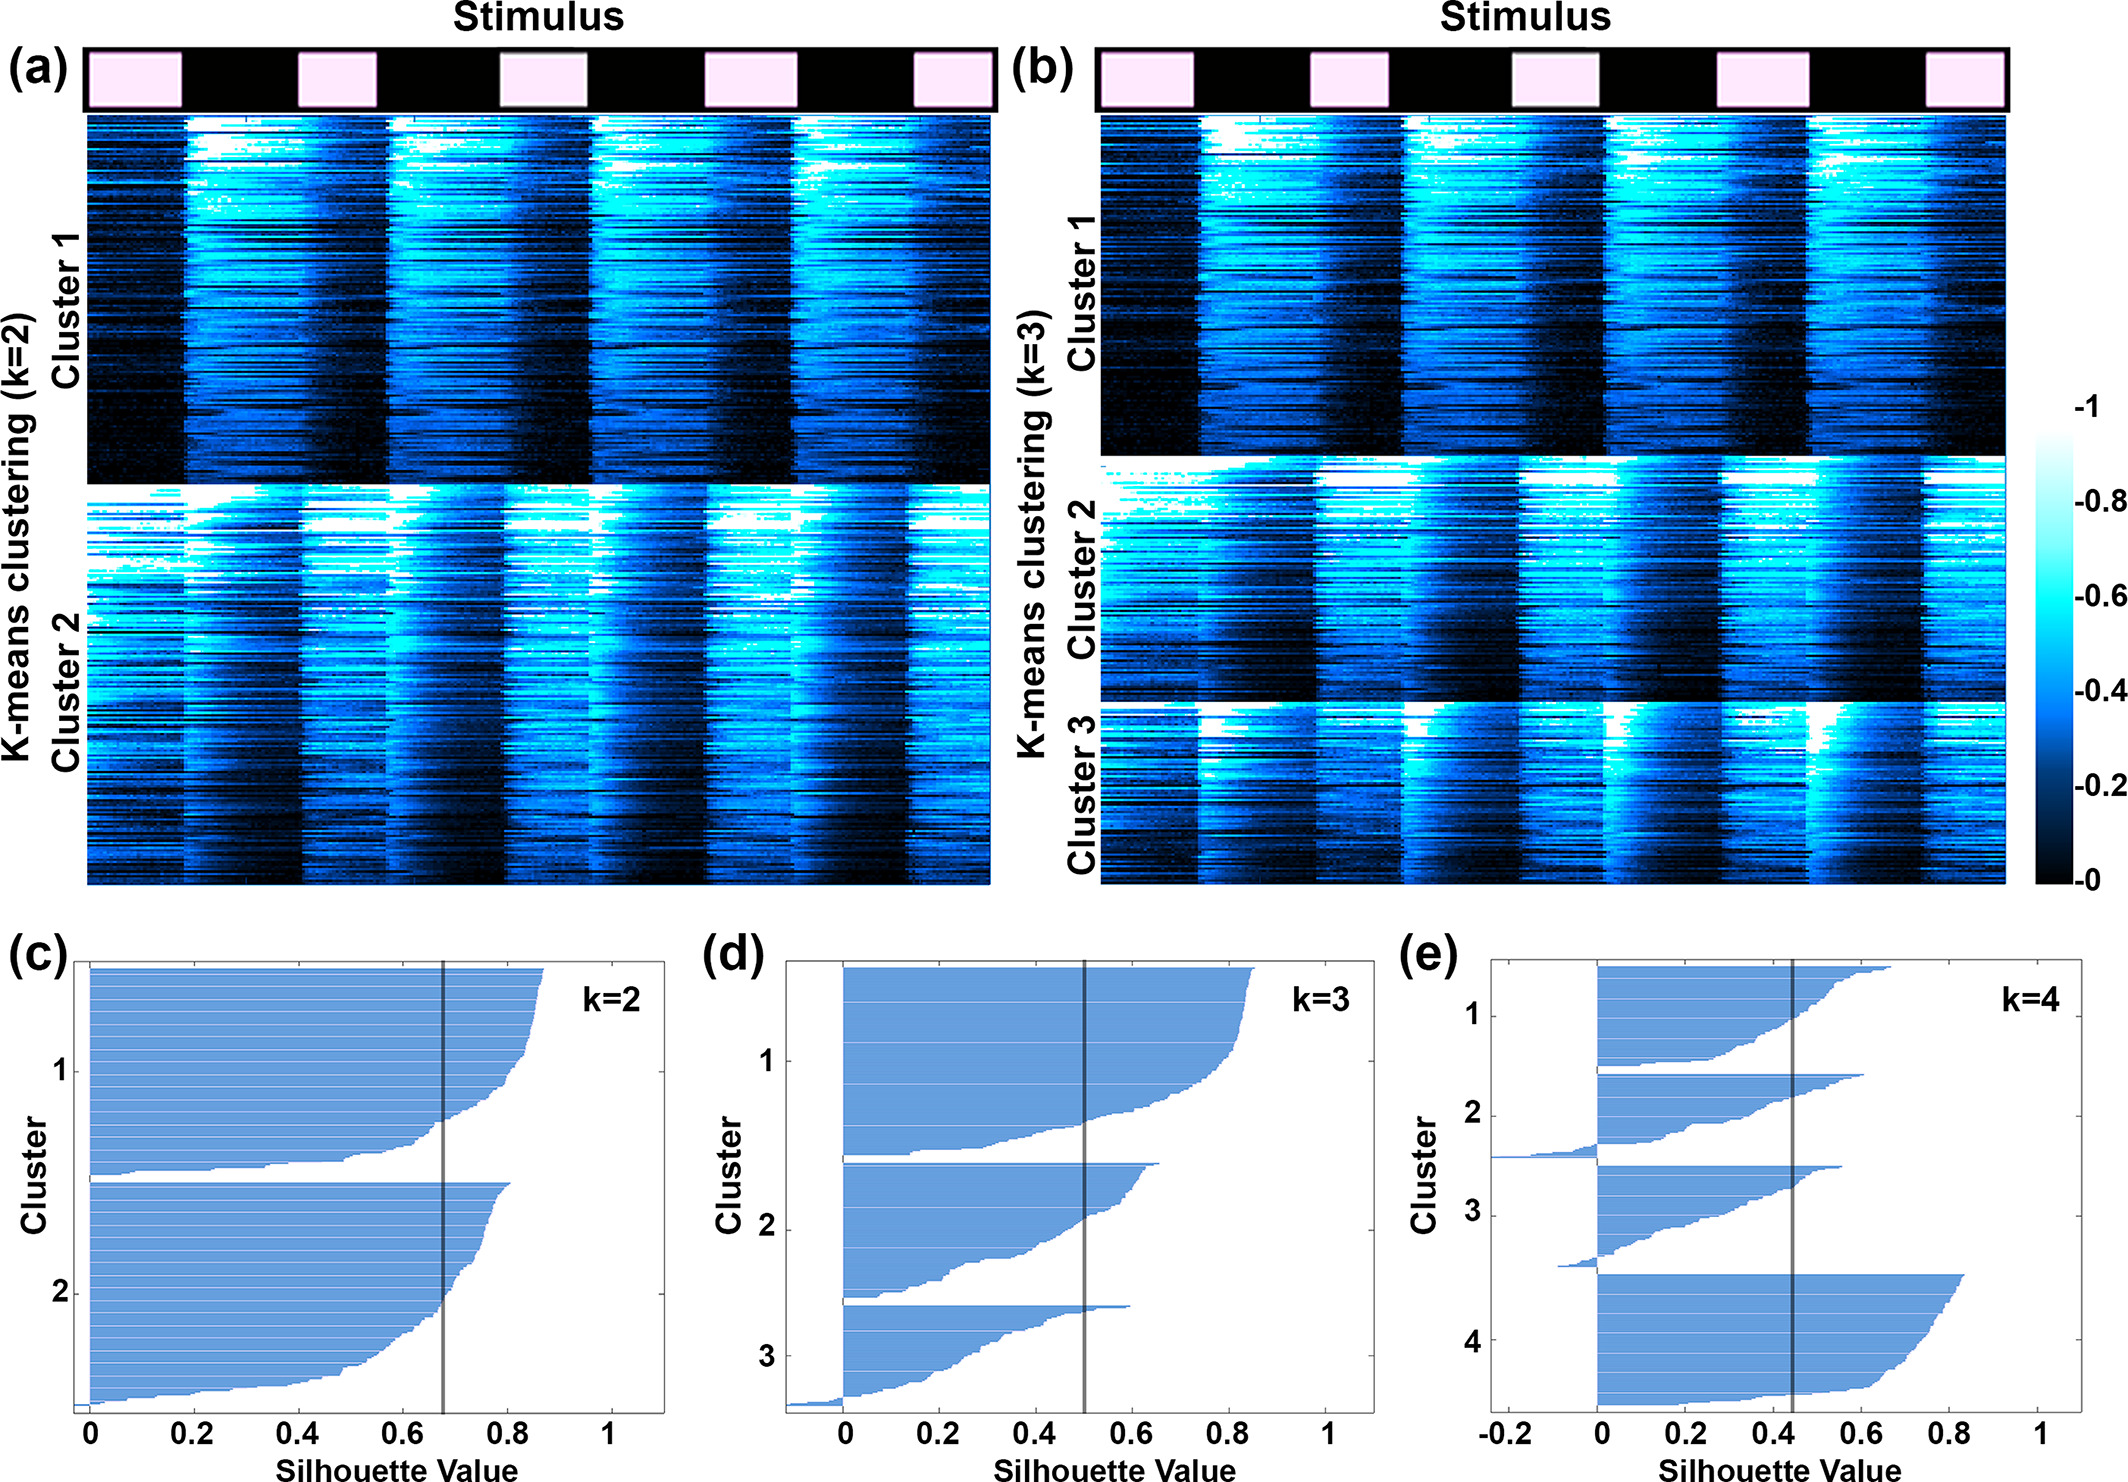
Fig. 3 K‐means clustering of automatically segmented retinal ganglion cell (RGC) regions of interest (ROIs). (a,b) Results of ks‐means clustering for 325 individual ROIs from 10 Tg(atoh7:gal4,uas:gcamp6s) tecta using k values of 2 and 3. Stimulus timing is indicated at top, with total recording duration of 75 s (7‐s stimulus‐ON, 10‐s stimulus‐OFF). Fluorescence intensity for each recording is displayed as a color raster plot based on color scale at right. Note that in both (a and b), Cluster 1 is comprised of RGC terminals with strong and consistent OFF responses. (c–e) Silhouette plots for k values of 2, 3, and 4. Vertical gray line in each plot indicates average silhouette value. The highest average silhouette value in (c) indicates that the data are best fit by a k value of 2