
|
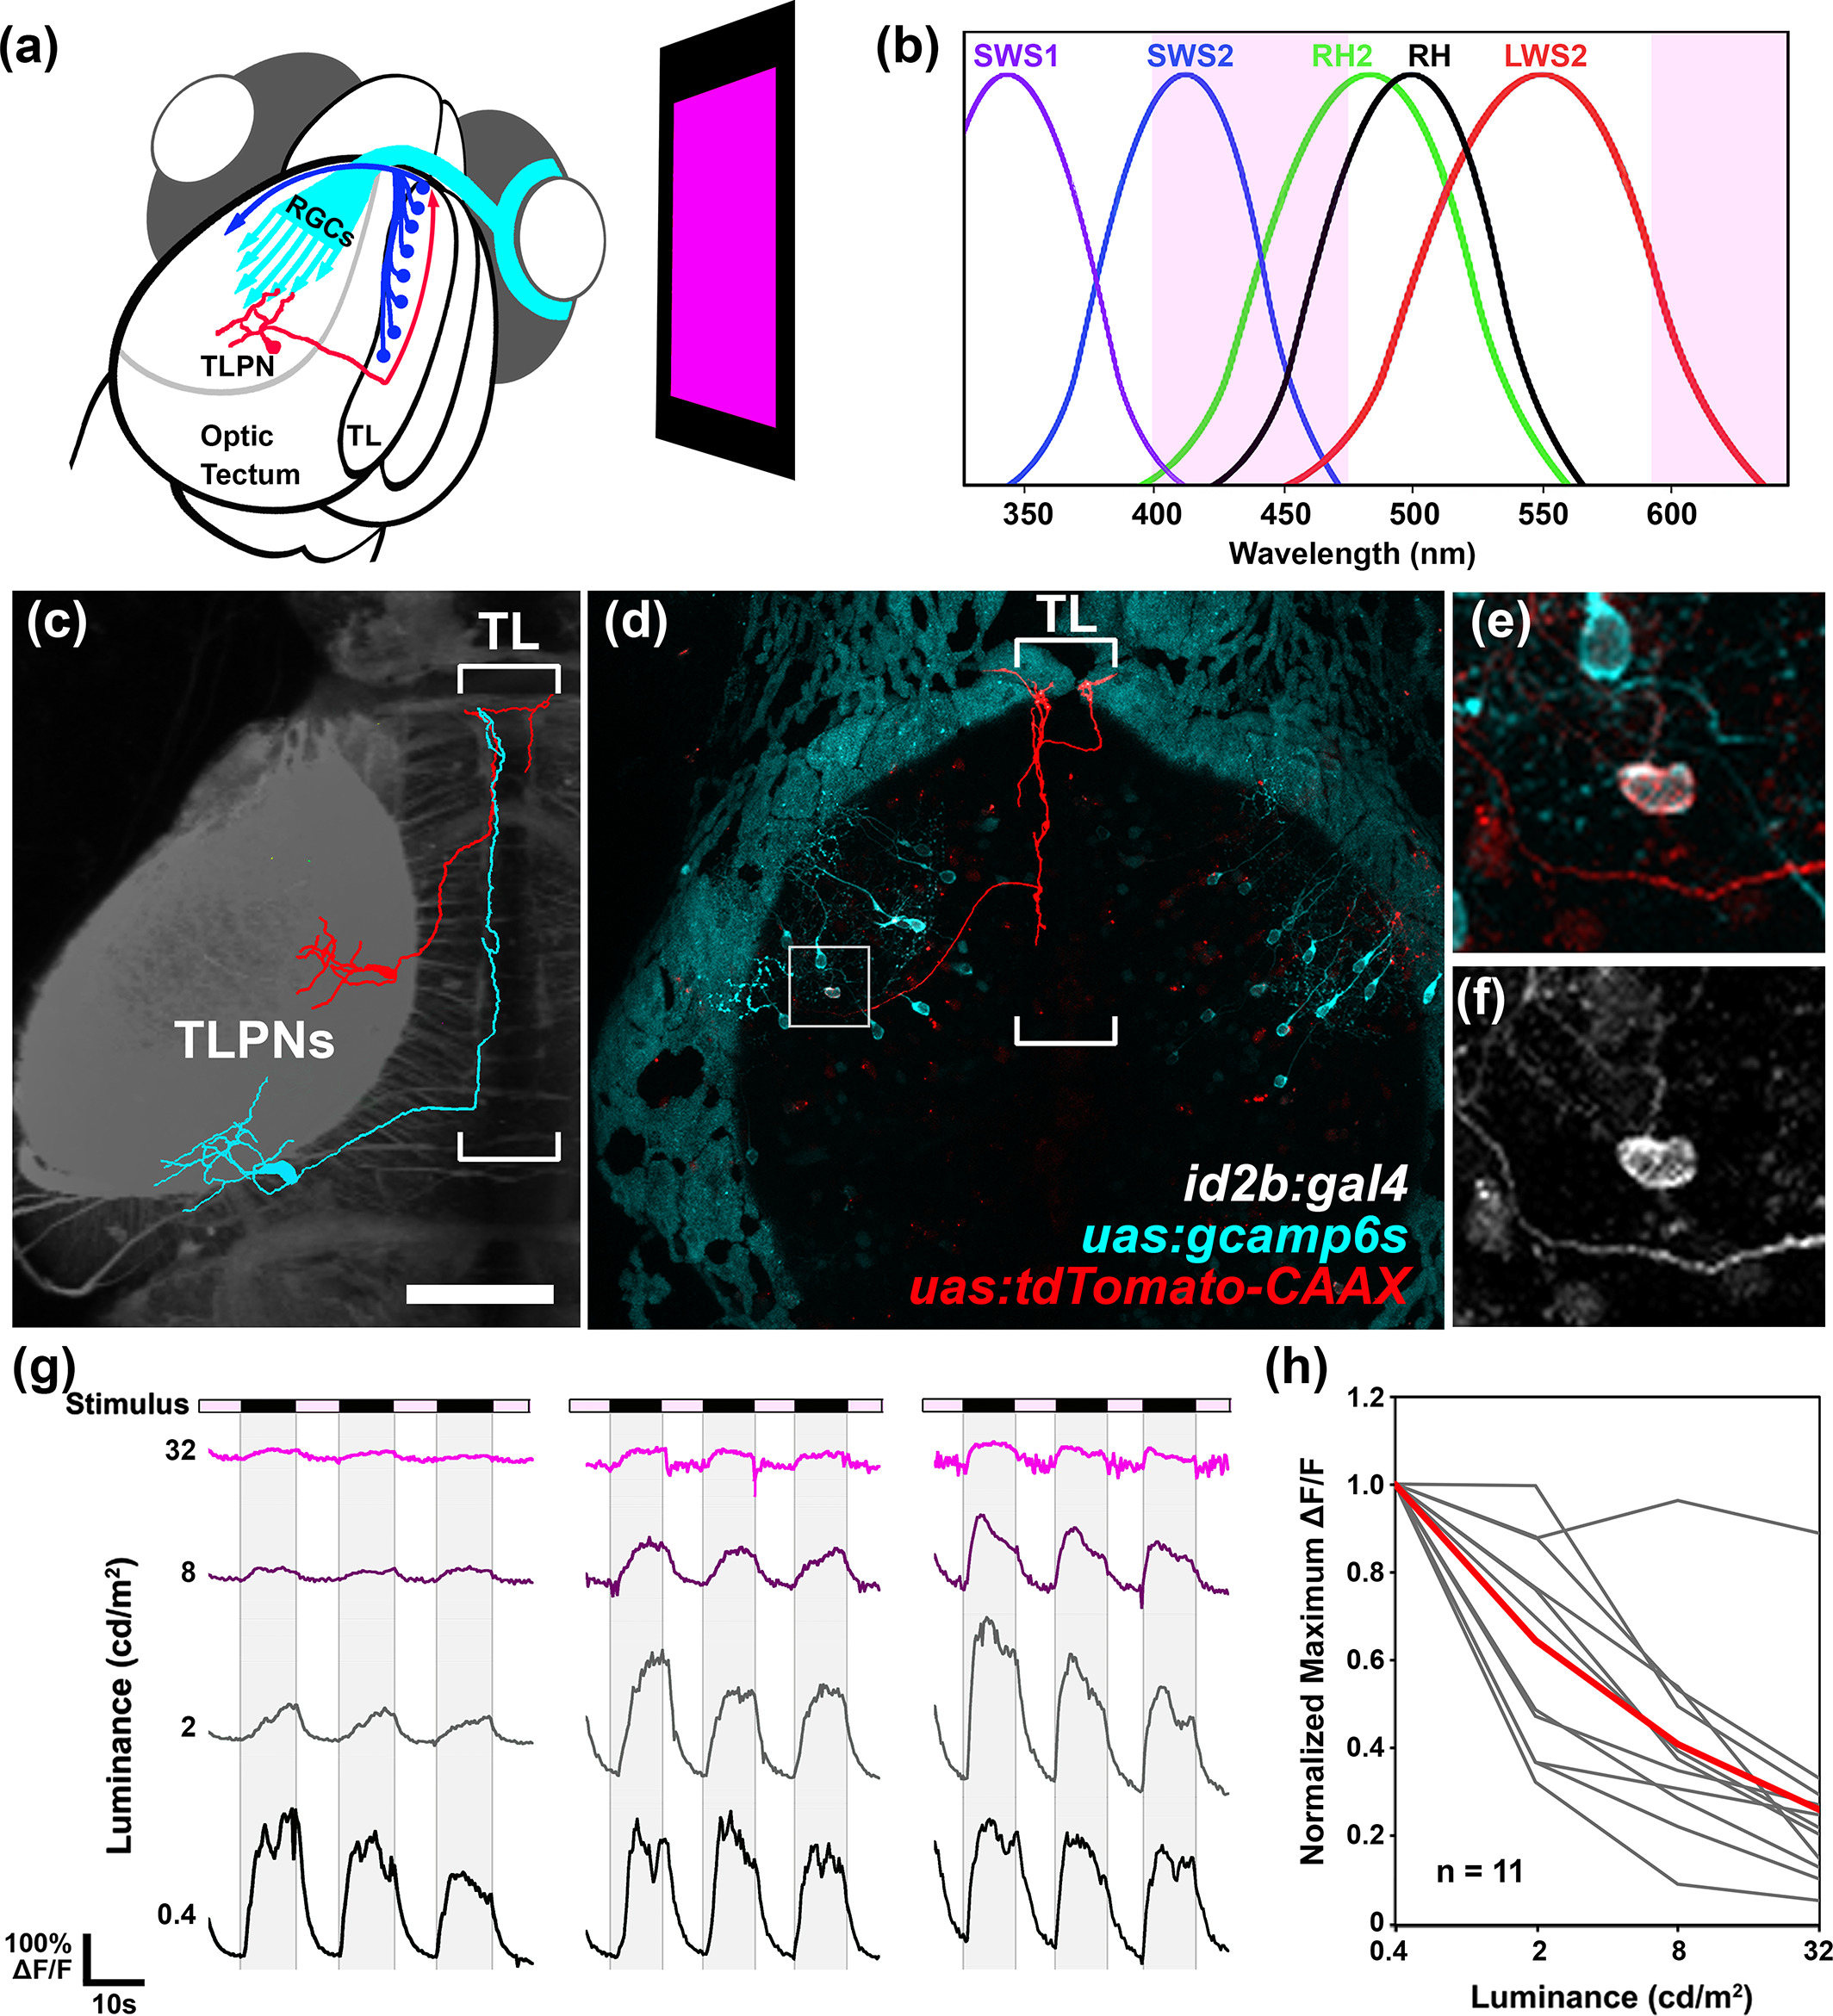
Fig. 1 Torus longitudinalis projection neuron (TLPN) responses to whole‐field dimming stimuli. (a) Schematic overview of experiments performed in this study. An organic light‐emitting diode (OLED) screen equipped with magenta filters is positioned in front of one eye of an agarose‐embedded Tg(id2b:gal4,uas:gcamp6s) double transgenic larva, which drives tissue‐specific expression of the calcium sensor protein GCaMP6s. (b) Absorption curves for the photopigments expressed in UV cones (SWS1), blue cones (SWS2), green cones (RH2), red cones (LWS2), and rods (RH1). Region shaded in magenta indicates the wavelength range generated by the OLED stimulus, simultaneously activating rods as well as red, green, and blue cones. (c) Skeletonized tracings of two TLPNs overlayed on a gray scale dorsal view image of Tg(elavl3:LY‐TagRFP) brain containing left tectum and TL. Note that posterior positioned TLPN innervates TL posteriorly, whereas anteriorly positioned TLPN enters TL at its anterior pole and crosses the midline to innervate contralateral TL. (d) Dorsal view of a 7 dpf Tg(id2b:gal4,uas:gcamp6s) larva that was pressure injected at the early embryo stage to yield sparse tdTomato:CAAX labeling within the id2b:gal4 expression pattern. Note sparse tdTomato labeling of a single tectal neuron with an axon that enters TL, extends anteriorly, and crosses the midline within TL. (e) Higher magnification view of boxed regions in (d). (f) GCaMP6s fluorescence of TLPN cell body within boxed region in (d). (g) Example traces of GCaMP6s fluorescence from three individual TLPN neurons during presentation of whole‐field dimming stimuli with the following ON light intensities: 0.4, 2, 8, and 32 cd/m2. All three TLPNs responded maximally to trials with low intensity stimuli (≤2 cd/m2). (h) Effect of stimulus intensity on maximum ∆F/F values during OFF phase for 11 TLPNs during presentation of trials at the following light intensities: 0.4, 2, 8, and 32 cd/m2. Data from individual trials are shown in gray. Average of the 11 individual traces is shown in red. Scale bar: 100 μm in (a), 30 μm in (b)