
|
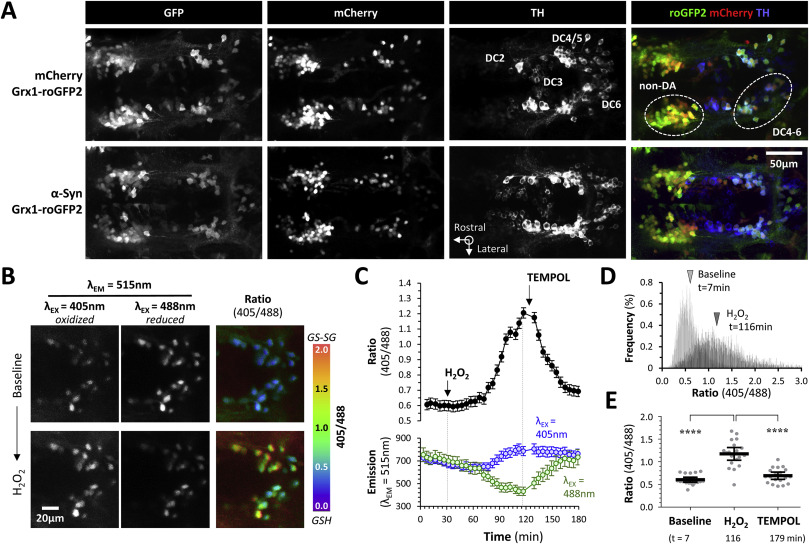
Fig. 9 Fig. 9. Transgenic zebrafish expressing human α-Synuclein and a ratiometric biosensor of glutathione oxidation in dopaminergic neurons in vivo. A: Confocal z-plane projections of fixed, whole mount Ctrl; Grx1-roGFP2 (upper row) and α-Syn; Grx1-roGFP2 (lower row) zebrafish labeled with antibodies to GFP, mCherry and tyrosine hydroxylase. The overlaid images are shown in the right column (GFP, green; mCherry, red; TH, blue). Groups of TH-expressing diencephalic dopaminergic neurons that also express the otpb enhancer element used in the driver line are numbered in the Ctrl TH image. The Ctrl overlay image indicates the locations of the DC 4–6 dopaminergic neurons imaged in live zebrafish in Fig. 10 and a more rostral group of non-dopaminergic neurons (non-DA) that also expresses the otpb enhancer and was imaged for comparison. B: Intravital confocal microscopy was used to image the Grx1-roGFP2 biosensor in the ventral diencephalon of an α-Syn; Grx1-roGFP2 zebrafish. Emission was captured at 515 nm following serial excitation at 405 nm (left column) and 488 nm (center column). The ratiometric image (right column; color scale shown to the right), calculated by dividing each image plane of the 405 nm dataset by the corresponding 488 nm image plane, shows the relative glutathione redox potential. The images show the dopaminergic DC4 – 6 neuronal groups; the top row shows baseline steady-state images and the bottom row shows images of the same zebrafish after application of 3 mM H2O2 to the bath. C: Unbiased 3D spot detection was used to quantify emission at 515 nm within DC4 – 6 dopaminergic neurons, following sequential excitation at 405 nm or 488 nm (bottom graph) and to calculate the 405/488 ratio (top graph) in serial images acquired every 4 min for 1 h. Each datapoint shows mean ± SE (n = 19 neurons). After stable baseline data were collected, H2O2 was added to the bath at t = 30 min and then H2O2 was removed and TEMPOL added to the bath at 120 min (arrows). D: Ratiometric histograms showing the frequency distribution of the Grx1-roGFP2 405/488 ratio from every pixel within areas corresponding to DC4 – 6 dopaminergic neurons in 2D images, at baseline (top panel) and after addition of H2O2 to the bath (bottom panel). The arrowheads show the mean of each distribution. E: Scatterplots showing baseline, peak and final Grx1-roGFP2 405/488 ratio in DC4 – 6 dopaminergic neurons following sequential exposure to H2O2 and TEMPOL. Data points represent individual neurons combined from 4 separate zebrafish; bars show mean ± SE; p < 0.0001****, 1-way ANOVA with Tukey multiple comparison test.