
|
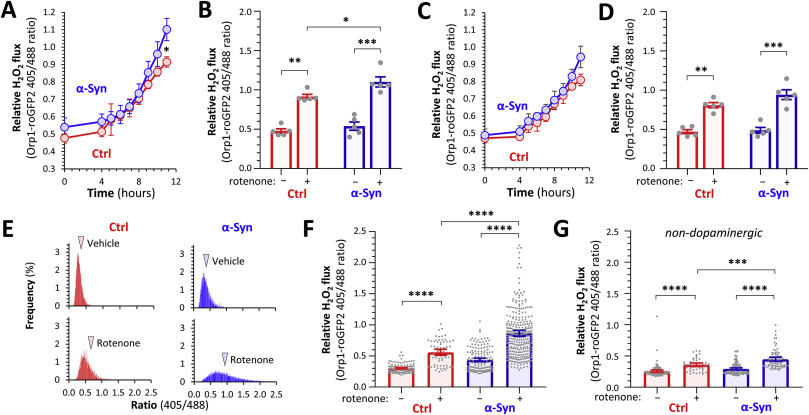
Fig. 8 Fig. 8 Download : Download high-res image (721KB)Download : Download full-size image Fig. 8. α-Synuclein enhances cytoplasmic peroxide flux in dopaminergic neurons following rotenone exposure. A – D: The roGFP2-Orp1 biosensor was imaged by intravital confocal microscopy in the ventral diencephalon of live Ctrl; roGFP2-Orp1 (red) and α-Syn; roGFP2-Orp1 (blue) zebrafish, at baseline and serially for 11 h after addition of rotenone to the bath (80 nM final concentration). 3D ratiometric analyses are shown for (A, B) DC4 – 6 dopaminergic neurons and (C, D) adjacent non-dopaminergic neurons (n = 5 neurons in each group). (A) and (C) show mean ± SE roGFP2-Orp1 405/488 ratio at each time point; p < 0.05* α-Syn vs. Ctrl at same time point, 2-way repeated measures ANOVA with Šidák multiple comparisons test. (B) and (D) show baseline and final roGFP2-Orp1 405/488 ratio; data points show individual neurons, bars show mean ± SE; p < 0.05*, 0.01**, 0.001***, 2-way ANOVA with Tukey multiple comparisons test. E – G: Ctrl; roGFP2-Orp1 (red) and α-Syn; roGFP2-Orp1 (blue) zebrafish were exposed to vehicle or rotenone (80 nM bath concentration) for 16 h and then the roGFP2-Orp1 imaged in live intact larvae by intravital confocal microscopy at a single time point. (E) Frequency distribution histograms from pixel-by-pixel 2D ratiometric analyses of DC4 – 6 dopaminergic neurons in vehicle-exposed (upper row) compared with rotenone-exposed (lower row) zebrafish. Arrowheads show the mean of each distribution. (F, G) 3D analysis of roGFP2-Orp1 405/488 ratios for (F) dopaminergic and (G) non-dopaminergic neurons. Data points show individual neurons (dopaminergic: Ctrl vehicle n = 107; Ctrl rotenone n = 66; α-Syn vehicle n = 154; α-Syn rotenone n = 304; non-dopaminergic: Ctrl vehicle n = 111; Ctrl rotenone n = 46; α-Syn vehicle n = 117; α-Syn rotenone n = 80 neurons, combined from 7 to 11 replicate zebrafish in each group); bars show mean ± SE; p < 0.05*, 0.0001****, 1-way ANOVA with Tukey multiple comparisons test.