
|
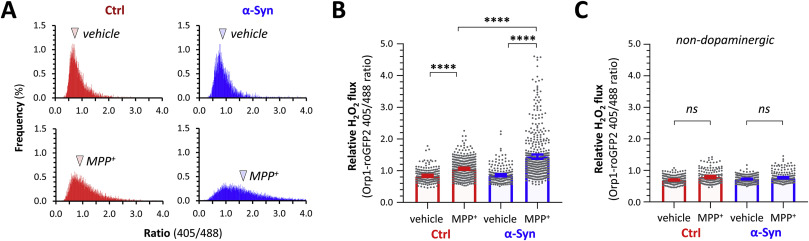
Fig. 7 Fig. 7. α-Synuclein enhances cytoplasmic peroxide flux in dopaminergic neurons during prolonged MPP+ exposure. Ctrl; roGFP2-Orp1 (red) and α-Syn; roGFP2-Orp1 (blue) zebrafish were exposed to vehicle (embryo water only) or MPP+ (0.5 mM bath concentration) for 16 h and then the ro-GFP2-Orp1 biosensor imaged in live intact larvae at a single time point. Emission at 515 nm following sequential excitation at 405 nm and 488 nm was recorded as shown in Fig. 4, Fig. 5, Fig. 6. A: Histograms showing the frequency distribution of the ro-GFP2-Orp1 405/488 ratio from every pixel within areas corresponding to DC4 – 6 dopaminergic neurons within 2D images from Ctrl (red, left column) and α-Syn (right, blue) zebrafish exposed to vehicle (upper row) or MPP+ (lower row). The arrowheads show the mean of each distribution. B, C: Scatterplots showing roGFP2-Orp1 405/488 ratio calculated from 3D image analysis, in (B) DC4 – 6 dopaminergic neurons and (C) adjacent non-dopaminergic neurons, from Ctrl (red) and α-Syn (blue) zebrafish exposed to vehicle or MPP+ for 16 h. Data points represent individual neurons (dopaminergic: Ctrl vehicle n = 181; Ctrl MPP+ n = 379; α-Syn vehicle n = 210; α-Syn MPP+ n = 470; non-dopaminergic: Ctrl vehicle n = 208; Ctrl MPP+ n = 156; α-Syn vehicle n = 254; α-Syn MPP+ n = 225 neurons, combined from 10 to 13 replicate zebrafish in each group); bars show mean ± SE; p < 0.0001****, 1-way ANOVA with Tukey multiple comparisons test.