
|
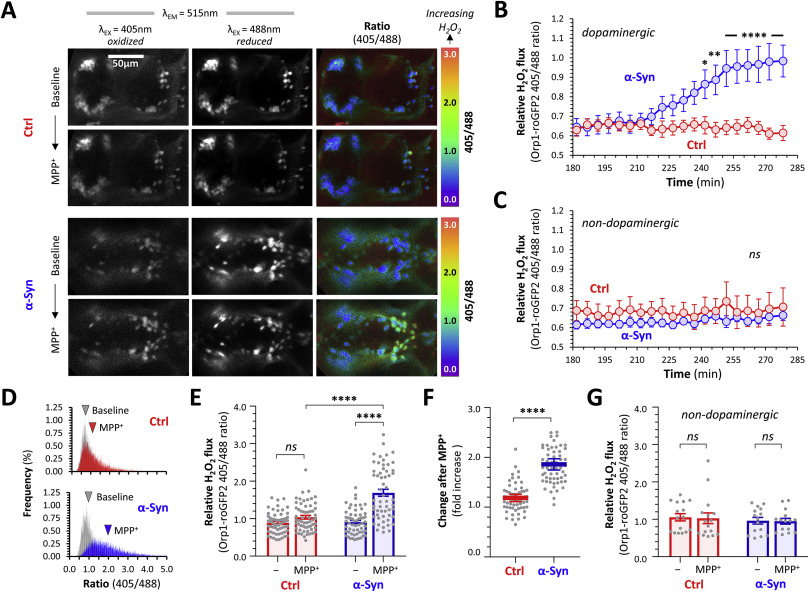
Fig. 5 Fig. 5. α-Synuclein increases cytoplasmic peroxide flux in dopaminergic neurons exposed to MPP+. A: Intravital confocal microscopy was used to image the roGFP2-Orp1 biosensor dynamically in the ventral diencephalon of live Ctrl; roGFP2-Orp1 (upper six panels) and α-Syn; roGFP2-Orp1 (lower six panels) zebrafish, at baseline (upper row of each set) and following exposure to MPP+ (lower row of each set; 3 mM final bath concentration). Emission at 515 nm following excitation at 405 nm and 488 nm respectively are shown in the first two columns and the ratiometric 405/488 images (color scale to right of images) in the third column of each set. B, C: Using the unbiased 3D spot detection method, the roGFP2-Orp1 405/488 ratio was calculated for (C) dopaminergic DC4 – 6 neurons (n = 7 to 8) and (D) adjacent non-dopaminergic neurons (n = 6 to 8), in serial images acquired every ≈5 min over 5 h. After stable baseline data were collected, MPP+ was added to the bath; the x-axis shows time after addition of MPP+. Each data point shows mean ± SE; p < 0.05*, 0.01**, 0.0001**** Ctrl vs. α-Syn at same time point, 2-way repeated measures ANOVA with Šidák multiple comparisons test. D: Ratiometric histograms showing the frequency distribution of the 405/488 ratio from every pixel within areas corresponding to DC4 – 6 dopaminergic neurons on 2D images at baseline (grey) and t = 280 min after addition of MPP+ for Ctrl (red) and α-Syn (blue) zebrafish. The arrowheads show the mean of each distribution. E: Scatterplot showing roGFP2-Orp1 405/488 ratio calculated using the 3D method, in DC4 – 6 dopaminergic neurons from Ctrl (blue) and α-Syn (red) zebrafish, at baseline and following exposure to MPP+. Data points represent individual neurons (Ctrl n = 57; α-Syn n = 59 neurons, combined from 4 replicate zebrafish); bars show mean ± SE; p < 0.001**, 0.0001****, 2-way ANOVA with Tukey multiple comparison test. F: Scatterplot showing fold increase in roGFP2-Orp1 405/488 ratio between baseline and post-MPP+ exposure for each individual cell shown in panel E. Bars show mean ± SE; p < 10−15 ****, 2-tailed unpaired t-test. G: Scatterplot showing baseline and peak roGFP2-Orp1 405/488 ratio in non-dopaminergic diencephalic neurons following exposure to MPP+, from the same zebrafish analyzed in panel E (n = 16 neurons per group). Data points, bars, and analysis identical to panel E.