
|
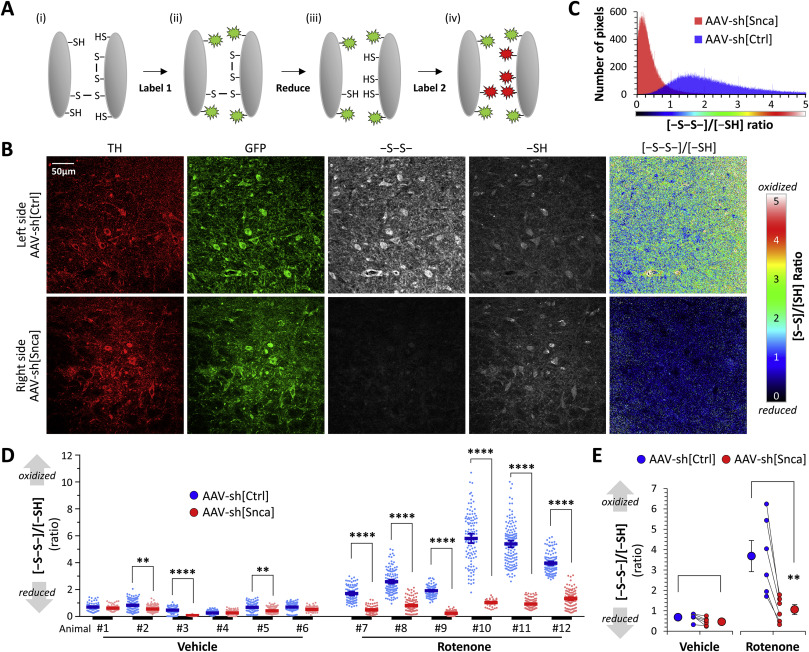
Fig. 2 Fig. 2. α-Synuclein knockdown mitigates rotenone-induced thiol oxidation in dopaminergic neurons in vivo. A: Schematic illustration of the thiol histochemical method used in panels B–E. Reduced thiol groups were irreversibly labeled with a maleimide-conjugate fluorophore. Disulfide bonds were then reduced and the resulting newly-generated thiols labeled with maleimide conjugated to a second fluorophore. The relative signal intensity of the two fluorophores was determined by confocal microscopy, providing a map of thiol oxidation in the tissue sample. B: Confocal micrographs of a midbrain section from a rat that received AAV-sh[Ctrl] in the left substantia nigra (top row) and AAV-sh[Snca] in the right substantial nigra (bottom row), followed by 6 days of rotenone (see Fig. 1A). The images show: immunofluorescence for tyrosine hydroxylase (TH; red); immunofluorescence for GFP (green); oxidized thiols (-S-S-; grayscale); reduced thiols (-SH; grayscale). The final column shows the ratiometric image for oxidized/reduced thiols, pseudocolored according to the scale shown to the right of the panel. C: Histogram showing the frequency distribution of the oxidized/reduced thiol ratio in each pixel of the images shown in panel B. D: Scatterplots showing thiol oxidation, analyzed in dopaminergic neurons on both the left (AAV-sh[Ctrl]; blue) and right (AAV-sh[Snca]; red) sides of the substantia nigra in 6 vehicle (animals #1 - #6) and 6 rotenone (animals #7 - #12) treated rats. Data points show the mean oxidized/reduced thiol ratio in individual dopaminergic neurons, bars show mean ± SE for each side of each animal. p <**0.01, ****0.0001, left vs. right, 1-way ANOVA with Tukey multiple comparisons test. E: Mean dopaminergic neuron thiol oxidation is shown for the two sides of the midbrain in each animal (small markers; the two sides of each animal are connected by a line) alongside mean ± SE for all six animals in each group (large markers). p < 0.01**, left vs. right, 2-tailed paired t-test.