
Image
|
Figure Caption
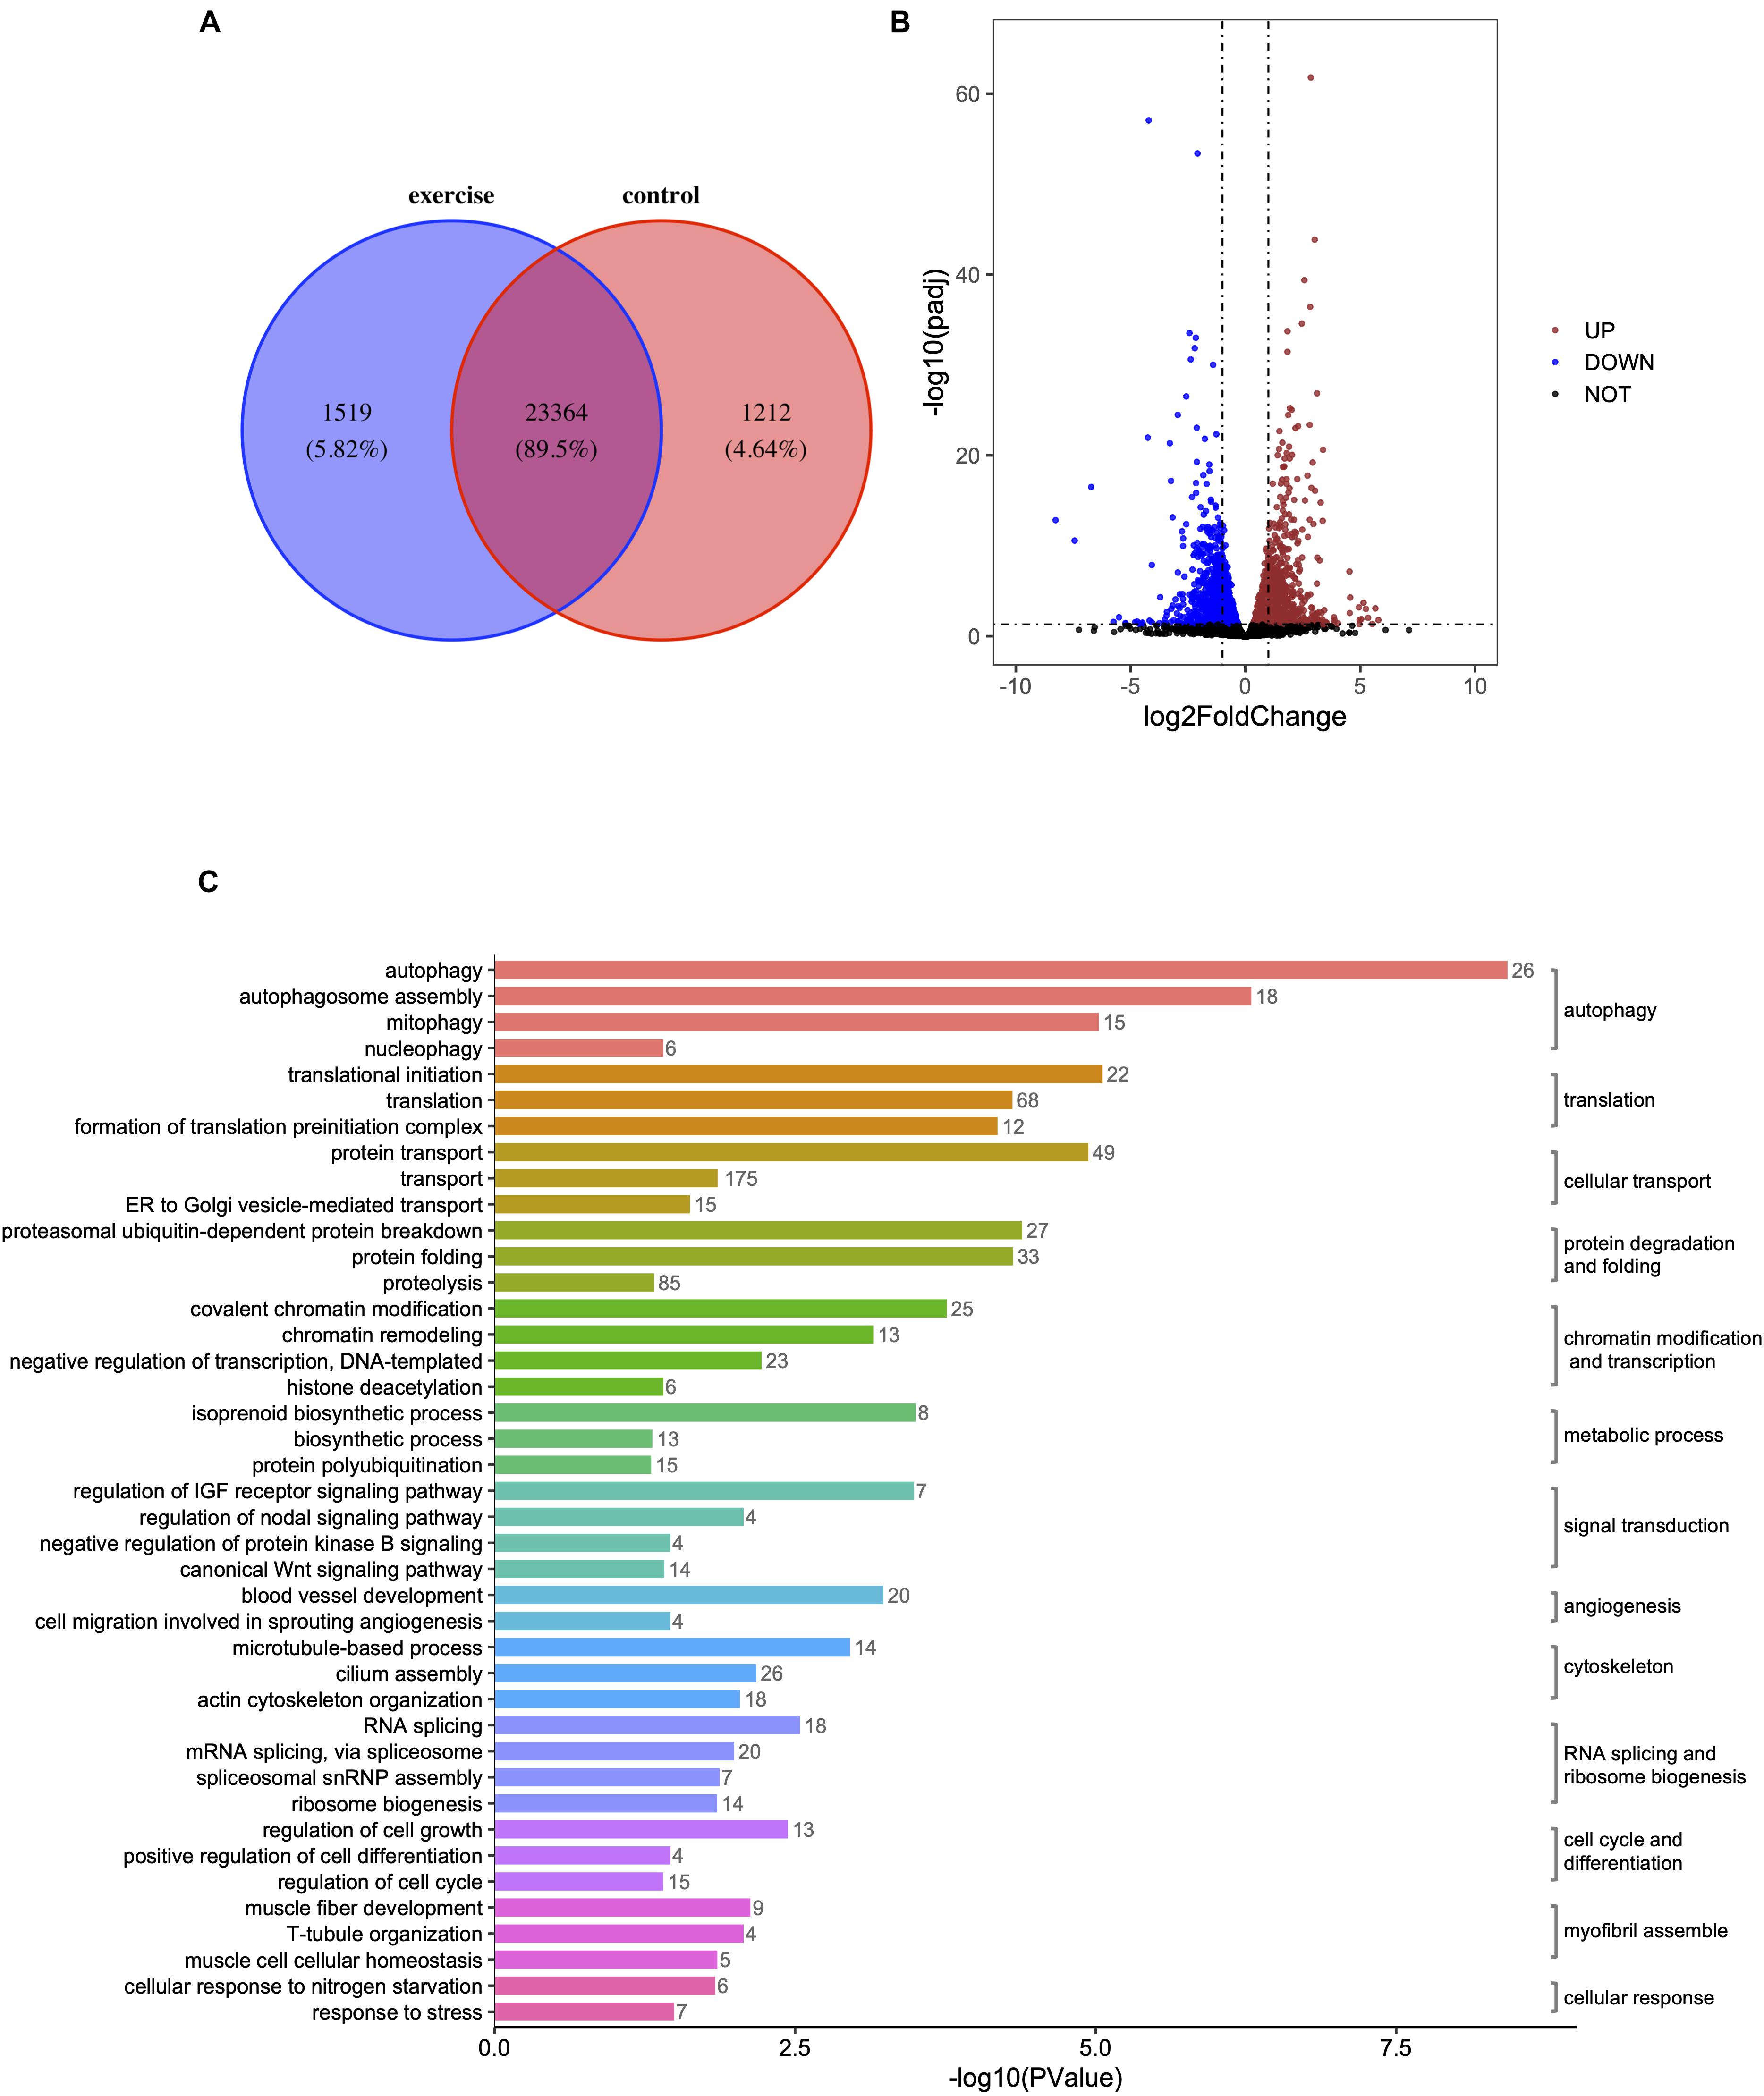
Fig. 2 Figure 2. Identification of differentially expressed genes (DEGs) and enrichment analysis of GO terms in zebrafish hearts after excessive exercise and in the control group. (A) Venn diagram of the total number of identified genes in the excessive exercise and control groups. (B) Volcano plot constructed using fold-change values and P adj-values. Red: upregulated, Blue: downregulated. (C) The DEG enrichment analysis of GO terms in the biological process subcategory. The number indicates the number of DEGs that are enriched in the clustered representative terms.
Acknowledgments
This image is the copyrighted work of the attributed author or publisher, and
ZFIN has permission only to display this image to its users.
Additional permissions should be obtained from the applicable author or publisher of the image.
Full text @ Front. Physiol.