
|
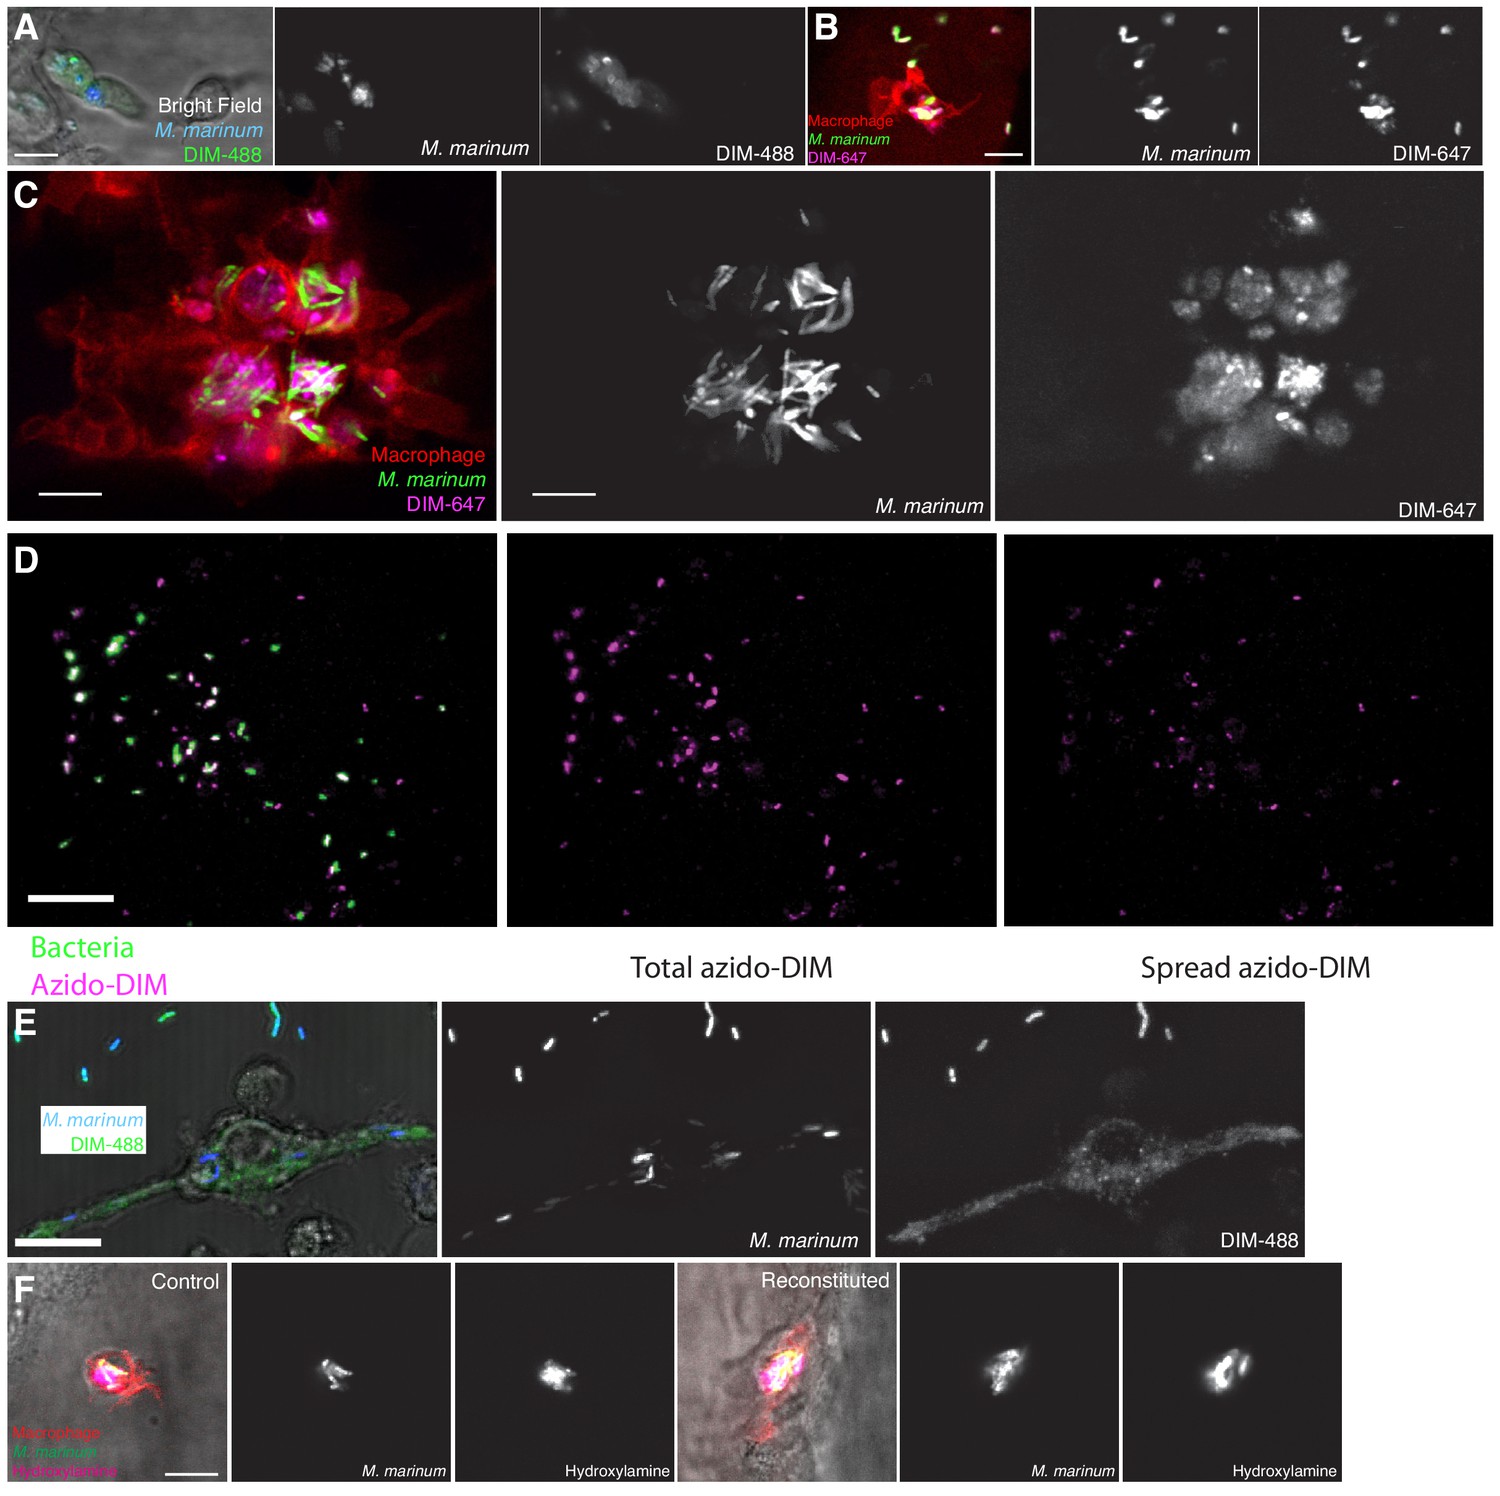
Fig. 3 Supplement Further characterization of PDIM spread. (A) Image of M. marinum expressing a cytosolic blue-fluorescent protein recoated with DIBO-488 (green) labeled azido-DIM at 3hpi of ~100 M. marinum in the HBV of wildtype fish. Scale bar = 10 μm. Images of M. marinum expressing a cytosolic wasabi fluorescent protein recoated with DIBO-647 labeled azido-DIM (DIM-647) at (B) 3 hpi and (C) 3 dpi of ~100 M. marinum in the HBV of transgenic fish whose macrophages express the red-fluorescent protein tdTomato. Scale bar = 10 μm. (D) Example of calculating percent spread: A surface rendering of the cytosolic expressing protein of the fluorescent bacteria (green) is subtracted from the total azido-DIM signal (magenta) to give the spread azido-DIM signal. The volume of the spread azido-DIM signal is then divided by the volume of the total azido-DIM signal to calculate percent spread. Scale bar = 50 μm. (E) Image of M. marinum expressing a blue-fluorescent protein recoated with DIM-488 24 hpi of THP-1 macro- phages, MOI = 5, and scale bar = 10 μm. (F) Images of control or recoated M. marinum expressing a cytosolic green-fluorescent protein labeled with periodate-hydroxylamine chemistry at 3 hpi of ~100 M. marinum into the HBV of transgenic fish whose macrophages express a fluorescent protein, scale bar = 10 μm.