
|
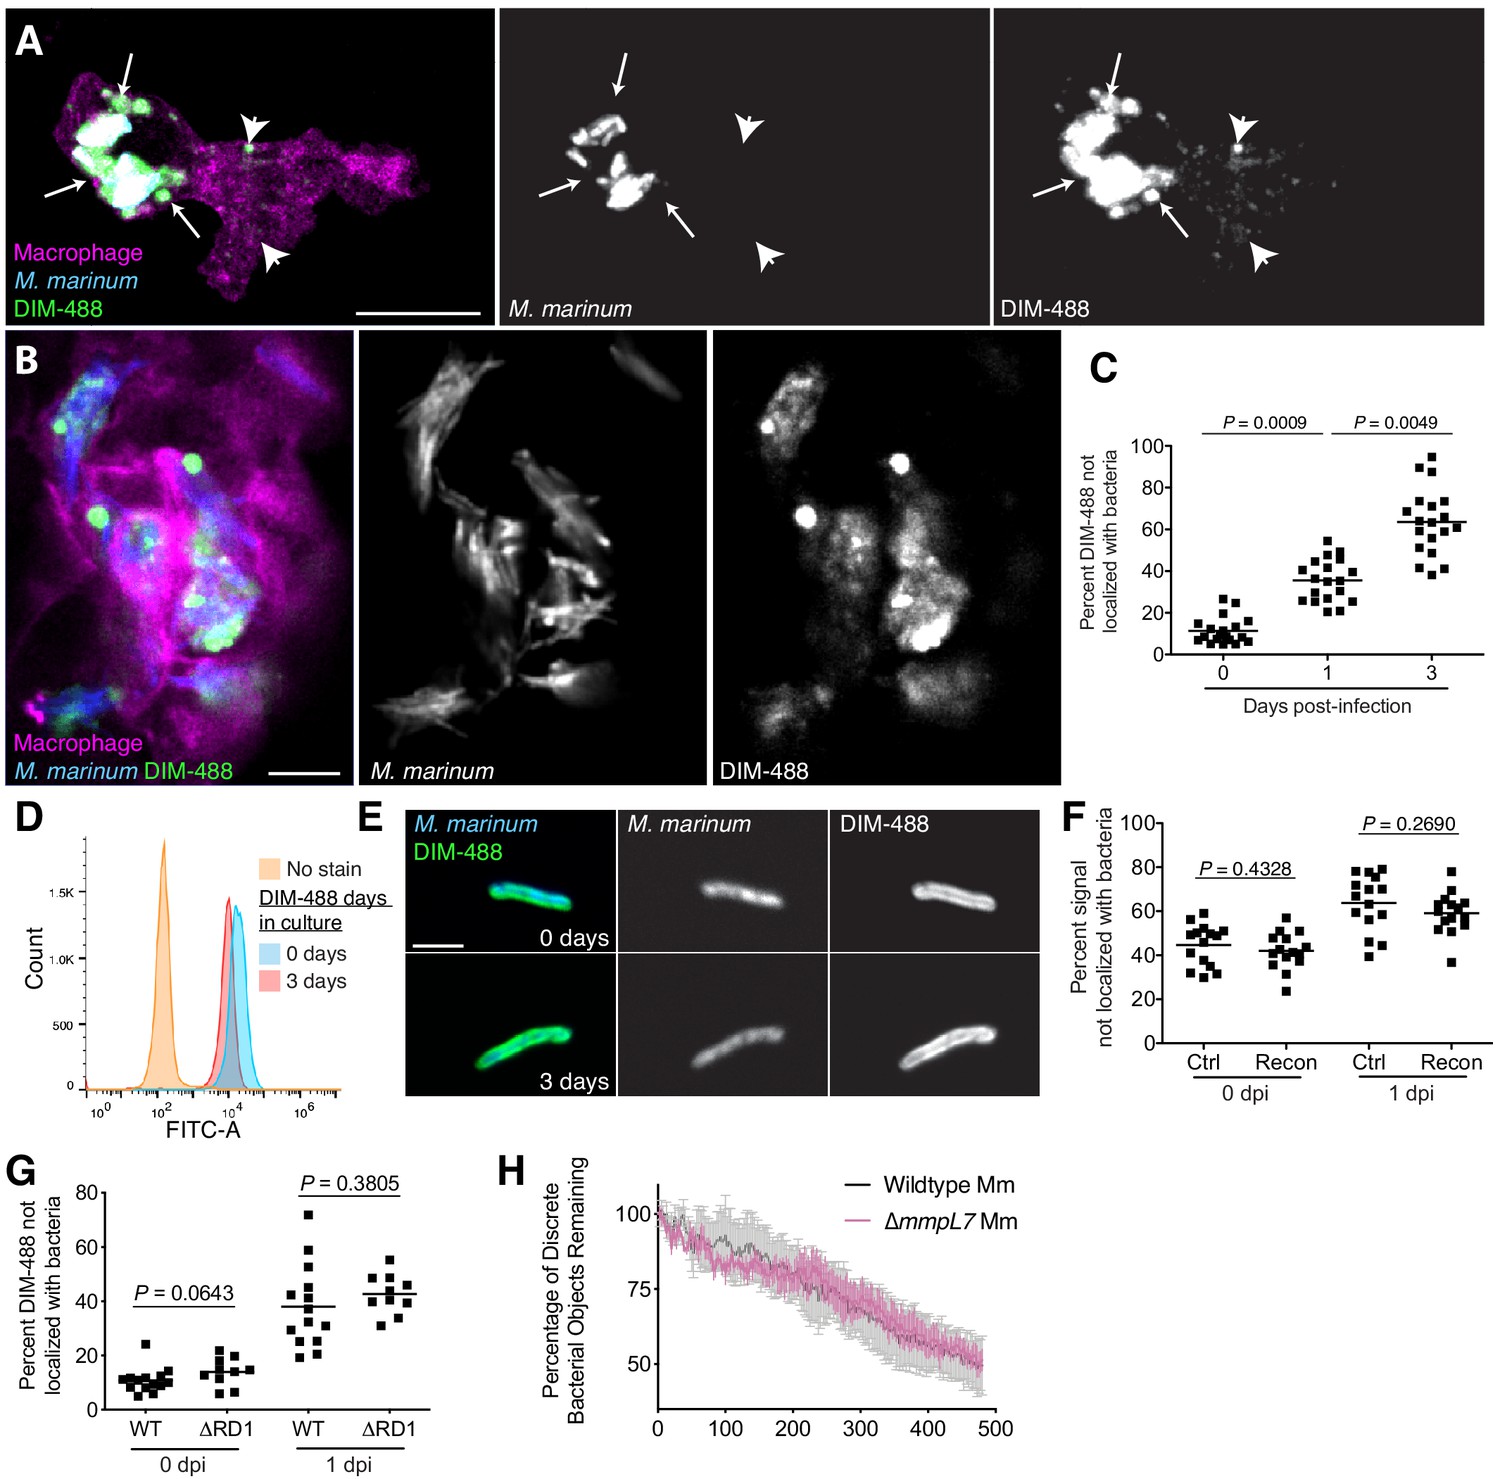
Fig. 3 PDIM spreads into macrophage membranes. Images of M. marinum expressing a cytosolic blue-fluorescent protein recoated with DIBO-488 labeled azido-DIM (DIM-488) at (A) 3 hpi and (B) 3 dpi of ~100 M. marinum in the HBV of transgenic fish whose macrophages express a fluorescent protein. Scale bar = 10 μm. Arrows, DIM-488 spread in vicinity of infecting bacteria, arrowheads, DIM-488 spread throughout macrophage. (C) Mean percent DIM-488 not localized with bacteria following HBV infection of wildtype fish with ~100 M. marinum. Kruskal-Wallis ANOVA for unequal variances with Dunn’s multiple comparisons test with selected adjusted P values shown. (D) Flow cytometry analysis of M. marinum expressing a cytosolic blue-fluorescent protein recoated with DIM-488 following 0 or 3 days in culture. Representative of two separate experiments. (E) Representative images of bacteria from D, scale bar = 3 μm. (F) Mean percent fluorescent signal not localized with bacteria following HBV infection of wildtype fish with ~100 control or recoated M. marinum labeled with periodate-hydroxylamine chemistry. Two-tailed, unpaired t test. (G) Mean percent DIM-488 not localized with bacteria following HBV infection of wildtype fish with ~100 wildtype or ∆RD1 M. marinum. Two-tailed Mann Whitney test for 0 dpi and two-tailed, unpaired t test for one dpi (H) Mean (+/- SEM) percentage of discrete bacterial objects remaining following HBV infection of wildtype fish with ~100 wildtype or ∆mmpL7 M. marinum. Representative of two separate experiments. (C), (F) and (G) representative of three separate experiments.