
Image
|
Figure Caption
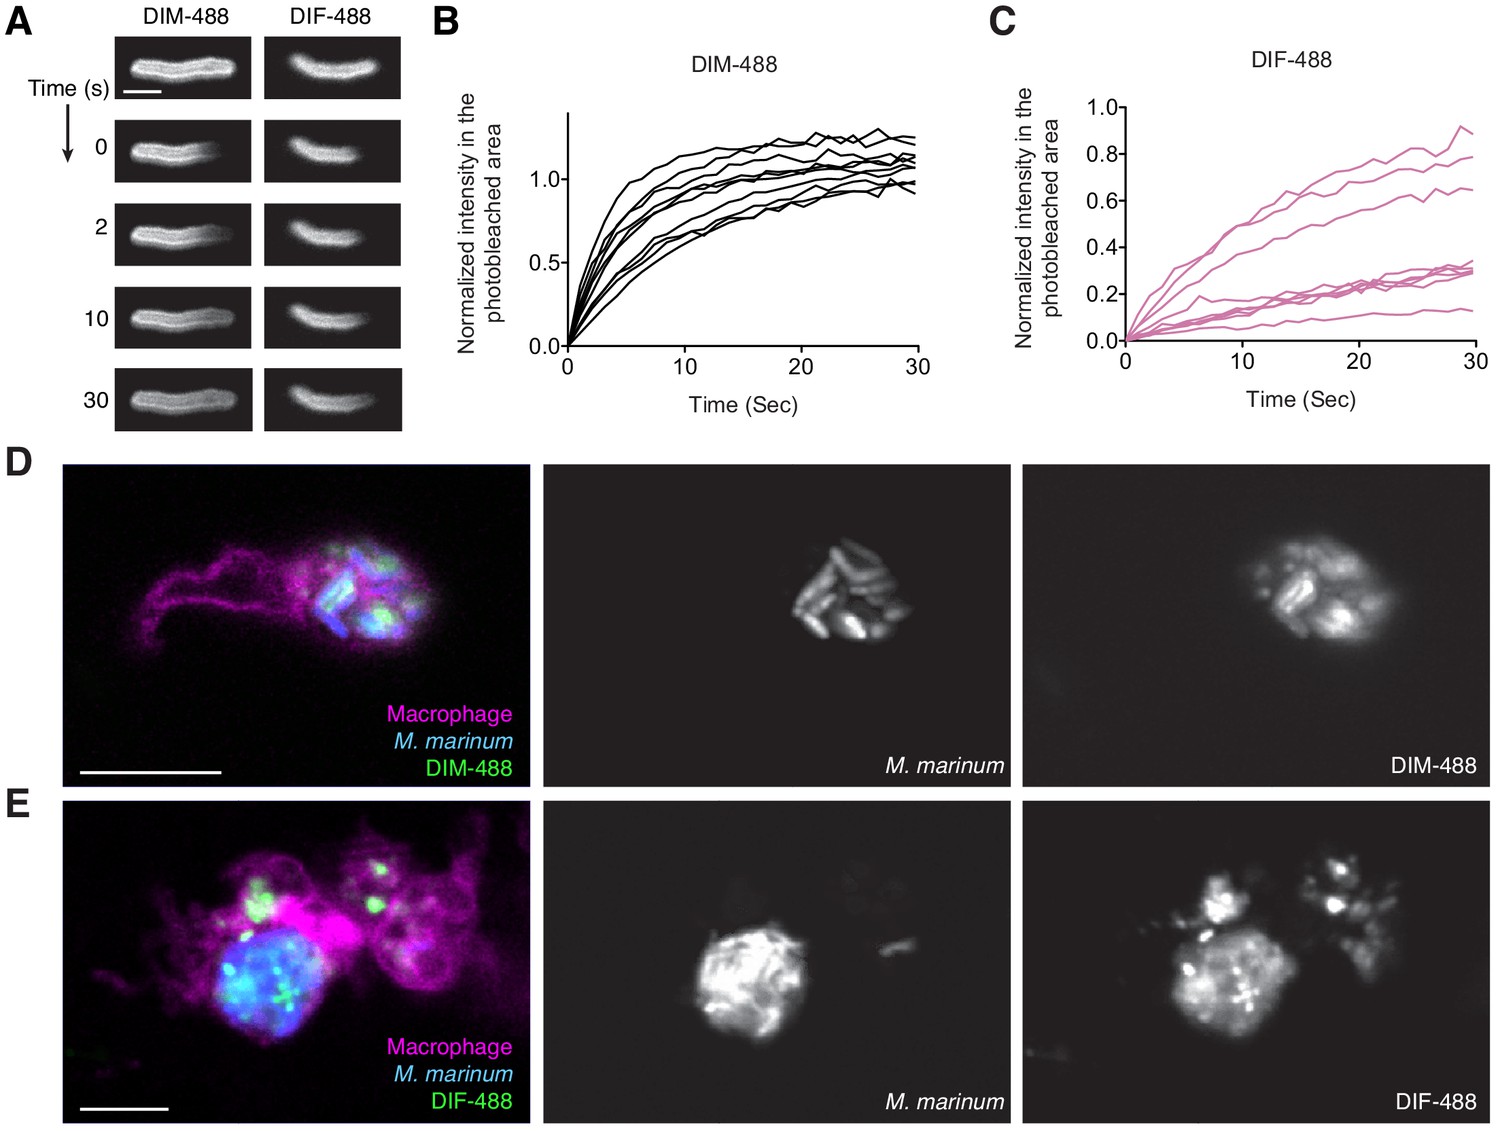
Fig. 6 Supplement Analysis of DIM-488 and DIF-488 labeled M.marinum. (A) Representative FRAP images of DIM-488 and DIF-488 labeled M. marinum, scale bar = 2 μm. Individual fluorescent recovery curves of (B) DIM-488 and (C) DIF-488 labeled M. marinum. Images of M. marinum expressing a cytosolic blue-fluorescent protein recoated with green (D) DIM-488 or (E) DIF-488 at 24 hpi of ~100 M. marinum in the HBV of transgenic fish whose macrophages express a red-fluorescent protein. Scale bar = 10 μm. (B) and (C) representative of three separate experiments.
Acknowledgments
This image is the copyrighted work of the attributed author or publisher, and
ZFIN has permission only to display this image to its users.
Additional permissions should be obtained from the applicable author or publisher of the image.
Full text @ Elife