
|
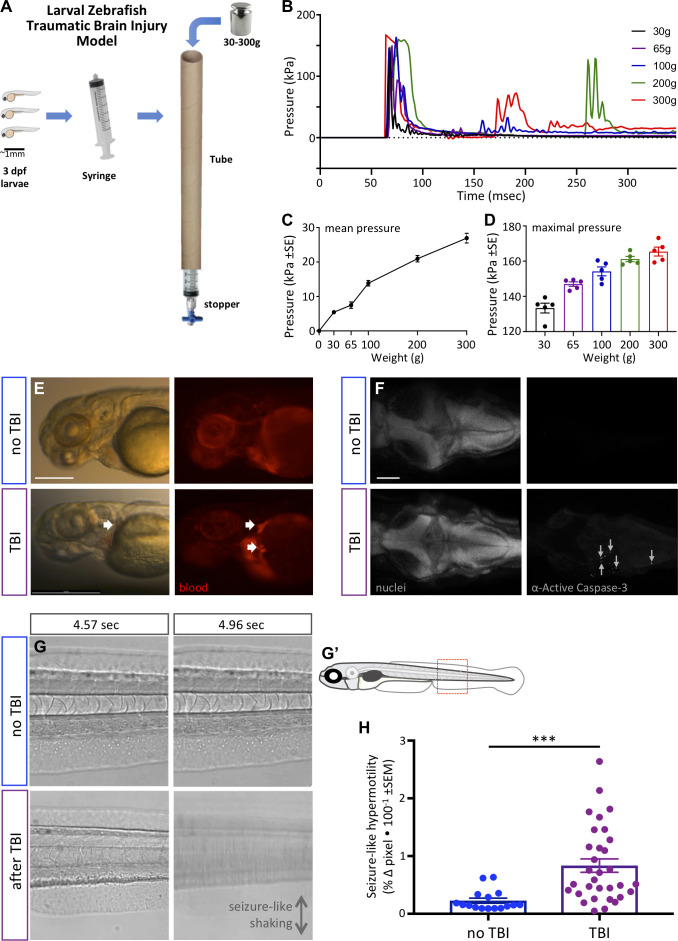
Figure 3 Zebrafish larvae subjected to traumatic brain injury (TBI) exhibited various biomarkers of TBI. (A) A novel TBI model for larval zebrafish: to induce blast injury, zebrafish larvae were loaded into a syringe with a stopper. A defined weight was dropped on the syringe plunger from a defined height, producing a pressure wave through the fish body akin to pressure waves experienced during human blast injury. (B) Dynamics of the pressure increase after dropping weights of varying masses in our TBI model. (C,D) The mean and maximum pressures generated, respectively, by various weights applied in the TBI model. Dots represent individual trials. (E) Hemorrhage after TBI was observed in some of the larvae fish using Tg[gata1a:DsRed] transgenic zebrafish that express DsRed in erythrocytes, as indicated by white arrows. Lateral view of larval heads with anterior at the left. Scale bar ≅250 μm. (F) Increased cell death in the brain of 4 dpf larvae subjected to TBI as indicated by immunostaining of activated Caspase-3 (magenta). Positive and negative controls for immunostaining are in supplement. Nuclei were stained with DAPI in gray for reference. These are dorsal views of larval zebrafish brains with anterior at the left. Scale bar is 100 μm. (G) Seizure-like clonic shaking is observed in a subset of larvae after TBI. Movie frames are displayed from Video 2. These frames (left and right panels) are separated by ~400 ms in time, and are lateral views of the larval zebrafish trunk (akin to red box in G’). Control fish without TBI show little movement except obvious blood flow. Following TBI, larvae show bouts of calm (bottom left) interspersed (~400 ms later) with bouts of intense seizure-like convulsions (Stage III seizures; bottom right). (H) Larvae subjected to TBI also displayed Stage II seizures, that is weaker seizures that manifest as hypermotility and are detected using a previously optimized behavioral tracking software system – seizures are significantly more intense following TBI compared to the control group (***p=0.0013, paired t-test; dots are raw data for each larva, mean is plotted ± SE).