
|
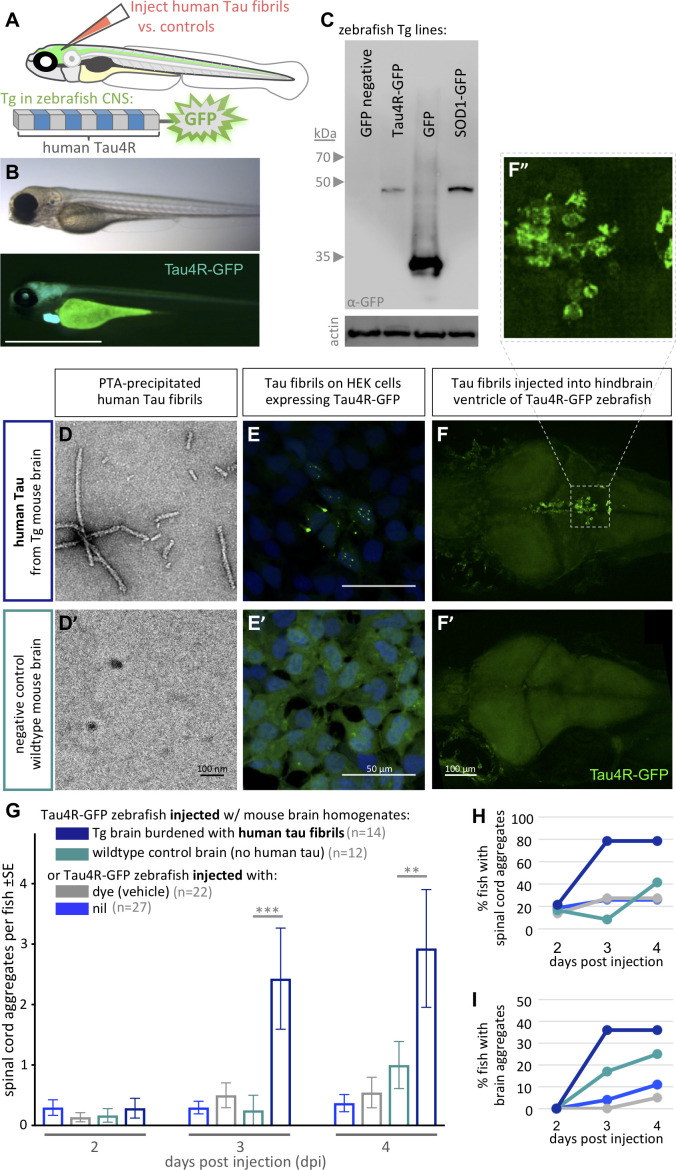
Figure 1 The biosensor Tau4R-GFP was validated for its ability to detect tauopathy seeds in vitro and in zebrafish. (A) Schematic of Tau4R-GFP ‘Tau biosensor’ that contains the four binding repeats (4R) region of wild-type human Tau linked to green fluorescent protein (GFP; see also Figure 1—figure supplement 1A). (B) Transgenic zebrafish engineered to express Tau4R-GFP biosensor throughout neurons of the CNS. Wild-type GFP is also abundant in the heart, which serves as a marker of the transgene being present but is otherwise irrelevant to our analyses. Scale bar ≅1 mm. (C) Western blot on zebrafish brain confirmed production of Tau4R-GFP at the expected size, similar to a SOD1-GFP biosensor and coordinately larger than GFP alone. (D) Human Tau fibril precipitated from transgenic (Tg TauP301L) mouse brain homogenates using PTA and assessed by EM. (E) Application of PTA-purified brain homogenate induced the formation of Tau inclusions similar to clarified brain homogenate (scale bar 50 μm; compare to Figure 1—figure supplement 1D), but application of equivalent preparations from non-Tg mice produced no GFP+ inclusions. (F–I) Tau biosensor zebrafish detects disease-associated human Tau fibrils following intraventricular injection of brain homogenate. Crude brain homogenates were microinjected into the hindbrain ventricle of Tau4R-GFP zebrafish larvae at 2 days post-fertilization, and Tau inclusions were analyzed at several time points. (F) Tau biosensor zebrafish larvae developed readily apparent GFP+ inclusions in the brain and spinal cord (Figure 1—figure supplement 2) when injected with brain homogenate burdened with Tau pathology (from Tg mice) but not from healthy brain homogenate (F’, from non-Tg mice). F’ inset shows many adjacent cells exhibiting GFP+ Tau aggregates. (G) Tau biosensor zebrafish injected with human Tau fibrils (within Tg mouse brain homogenate) developed significantly more aggregates on the spinal cord compared to uninjected control and other control groups, including compared to wildtype mouse brain homogenate (**p=0.0033 ***p=0.0006, ordinary two-way ANOVA and Tukey’s multiple comparison test). (H) Same data as in G, expressed as the percentage of larval fish showing Tau aggregates in the spinal cord, and (I) those same fish also showed Tau aggregates in the brain, over time. n = number of individual larvae. Images in E and F are 5 days post-application or post-injection, respectively.