
|
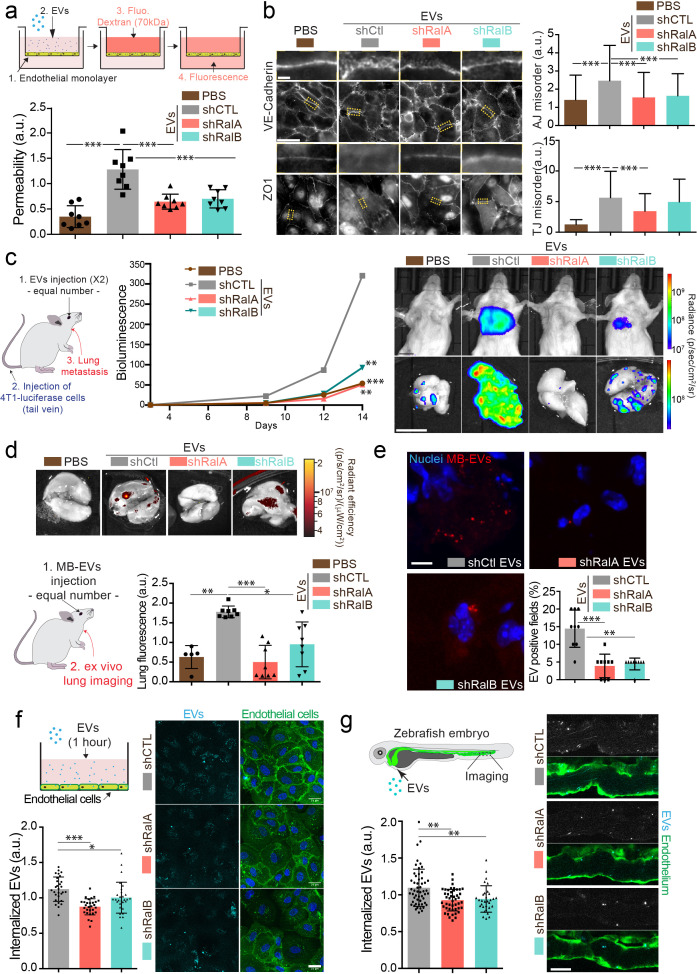
Figure 4 (a) Effect of a similar amount of EVs on HUVEC monolayer permeability in vitro. The graph represents the normalized amount of fluorescent dextran that crossed the endothelial barrier. Each dot represents one experiment (eight independent experiments; One-Way Anova followed by Bonferroni's Multiple Comparison Test). (b) Representative epifluorescence images of VE-cadherin (upper panels) and ZO1 (Lower panel) stainings on HUVECS cells treated with similar amounts of EVs. Scale bar: 20 μm; zoom: 2 μm. Graphs represent the disorganization of adherent (up) and tight (low) junctions (Three independent experiments; up; Kruskal-Wallis test followed by Dunn's Multiple Comparison Test). (c) Metastasis priming experiment, Balb/c mice are first injected twice with tumor equal number of EVs (1.5 × 10⁸ EVs), then intravenously with 4T1 luciferase cells and metastasis is then followed over time. Graph shows metastasis progression over time in mice pre-injected with PBS, or with equal number of EVs from shControl, shRalA or shRalB cells (7–10 mice per group; merge of two independent experiments; Two-way Anova followed by Bonferonni multiple comparison post test; stars indicate statistically significant differences at day 14). Right: In vivo and ex vivo representative images of mice and lungs at day 14. Scale bars: 1 cm. (d–e) Lung accumulation of equal number of fluorescent-labeled EVs (3 108 EVs), from shControl, shRalA or shRalB cells injected intravenously. (d) Representative ex vivo images and graph showing the total lung fluorescence 1 hr post-injection. Each dot represents one mouse. (Eight mice taken from two independent experiments; Kruskal-Wallis test followed by Dunn's Multiple Comparison Test.) (e) Representative confocal lung sections images and graph showing the percentage of EVs-positive fields. Each dot represents one section (three mice; Kruskal-Wallis test followed by Dunn's Multiple Comparison Test). Scale bar: 5 μm. (f–g) Arrest and internalization of equal number of EVs from shControl, shRalA, and shRalB cells on endothelial cells in vitro and in vivo. (f) Representative confocal Z-stacks of equal number of EVs after 1 hr or incubation with HUVEC monolayer. Scale bar: 25 μm. Each dot represents one field of view (each dot represents one field of view from three independent experiments; Kruskal-Wallis test followed by Dunn's Multiple Comparison Test). (g) Representative confocal Z-stacks the caudal plexus of Tg(Fli1:GFP) zebrafish embryos, where GFP is expressed in the endothelium, injected with similar number of EVs and imaged right after injection. Each dot represents one zebrafish (31–53 embryos from four independent experiments; Kruskal-Wallis test followed by Dunn's Multiple Comparison Test). Scale bar: 20 μm.