IMAGE

Fig 1

ID
ZDB-IMAGE-210128-7
Source
Figures for Petratou et al., 2021
Image
Figure Caption

Fig 1 A progressive fate restriction model for iridophore development from multipotent NCCs.

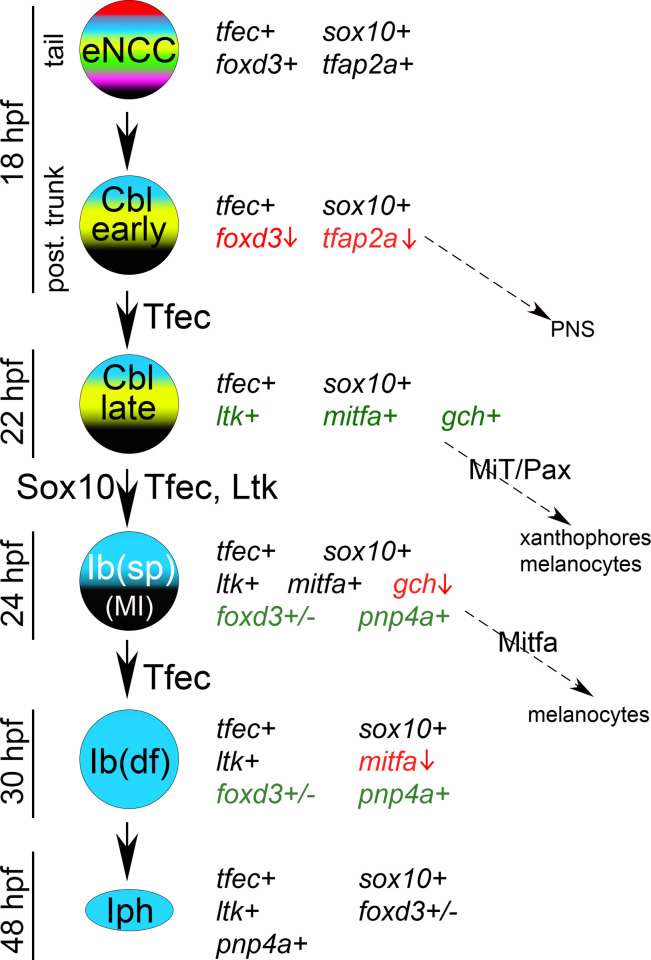
Schematic representation of the previously described model of iridophore generation from the NC, along with the expression characteristics and potential fate choices of individual arising cell types [14]. Genes actively expressed in each cell are indicated with a “+” sign. tfec is initially co-expressed with eNCC specification factors, which gradually become downregulated (red font, vertical red arrow), while lineage-specific factors become upregulated (green font). Proteins indicated on the vertical black arrows are considered important for the respective fate specification step. MiT, microphthalmia family transcription factors; PNS, peripheral nervous system.

Acknowledgments
This image is the copyrighted work of the attributed author or publisher, and ZFIN has permission only to display this image to its users. Additional permissions should be obtained from the applicable author or publisher of the image. Full text @ PLoS One