Image
Figure Caption

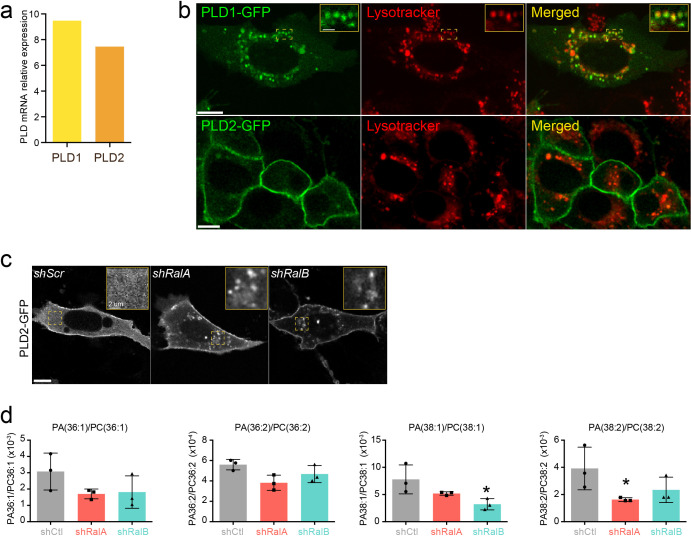
Figure 2—figure supplement 1. PLD1 and PLD2 in 4T1 cells.

(a) PLD1 and PLD2 expression in 4T1 shControl cells quantified by qRT-PCR and normalized by gapdh expression. (b) Representative confocal images showing PLD1-GFP and PLD2-GFP subcellular localization in 4T1 cells stained with lysotracker. Scale bars: 10 μm (c) Representative confocal images of PLD2-GFP localization in shControl, shRalA, and shRalB cells. Scale bar: 10 μm (d) PA/PC ratio of species known to be targeted by PLD1 identified in extracellular vesicles (EVs) isolated from shControl, shRalA, and shRalB cells. Each dot represents one experiment; three independent experiments.

Acknowledgments
This image is the copyrighted work of the attributed author or publisher, and ZFIN has permission only to display this image to its users. Additional permissions should be obtained from the applicable author or publisher of the image. Full text @ Elife