IMAGE

Fig 9

ID
ZDB-IMAGE-210128-37
Source
Figures for Petratou et al., 2021
Image
Figure Caption

Fig 9 <italic>tfec</italic> is broadly expressed during progressive fate restriction of the iridophore lineage from eNCCs, and is required to specify definitive iridoblast, Ib(df), from the melano-iridoblast, Ib(sp).

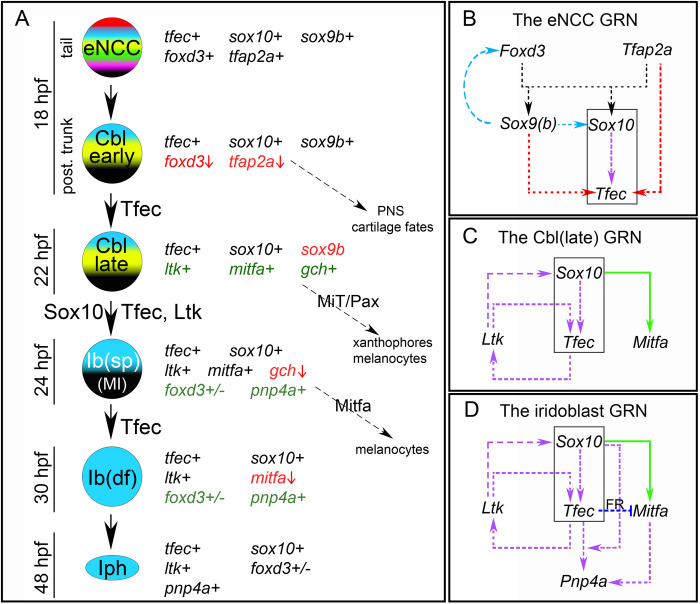
(A) Schematic representation of partially restricted iridophore progenitors during development, along with the expression characteristics and potential fate choices of each ([14], this work). tfec is initially co-expressed with eNCC specification factors, which gradually become downregulated (red font, vertical red arrow), while lineage-specific factors become upregulated (green font). Proteins indicated on the black arrows are considered important for the respective fate restriction step. (B) The position of tfec in the GRN guiding vertebrate NCC induction. Dashed arrows indicate interactions which could be either direct or indirect. In multipotent NCCs, Tfap2a and Foxd3 redundantly activate tfec expression (red arrows; this work), which is later maintained in the iridophore lineage by Sox10 (purple arrow; [14]). This activation occurs independently of previously described co-regulation of zebrafish sox9b and sox10 expression by Tfap2a and Foxd3 (black arrows; [49]), and is unaffected by potentially conserved activation of sox10 and foxd3 by Sox9b (blue arrows, as shown in chick; [50, 51]). (C) Following transition of Cbl early to Cbl late, tfec expression is supported by positive feedback interactions between Sox10, Ltk and Tfec, as described in Petratou et al., 2018 [14]. Sox10 directly activates mitfa expression (solid green arrow; [25]), which during early Cbl specification is co-expressed with tfec [14], inhibiting its expression to bias progenitors towards the melanocyte fate. (D) As the lineage progresses past the Cbl, into the Ib(sp), Ib(df) and mature iridophore stages, factor R (FR) mediates Tfec-dependent downregulation of Mitfa (dark blue edge), and expression of the marker pnp4a becomes prominent [14]. In (B-D) the black box outlines the core connecting the three networks. MiT, microphthalmia family transcription factors; PNS, peripheral nervous system.

Acknowledgments
This image is the copyrighted work of the attributed author or publisher, and ZFIN has permission only to display this image to its users. Additional permissions should be obtained from the applicable author or publisher of the image. Full text @ PLoS One