
|
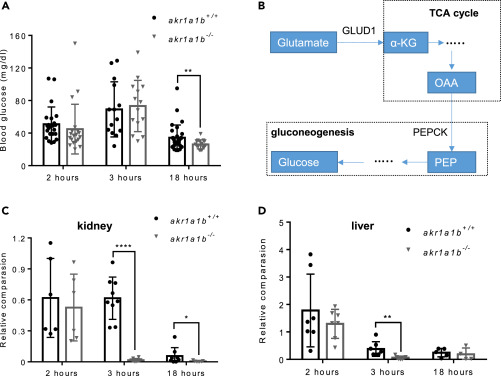
Fig. 6 Figure 6Inhibition of Gluconeogenesis Led to Hypoglycemia in Overnight Fasted akr1a1b-/-Zebrafish (A) Blood glucose was measured at different time points after feeding in adult akr1a1b+/+ and Δ+17/Δ-23 akr1a1b-/- zebrafish and found hypoglycemia after overnight fasting in akr1a1b-/- zebrafish (2 h postprandial: n = 23 in akr1a1b+/+, n = 20 in akr1a1b-/-; 3 h postprandial: n = 14 in akr1a1b+/+, n = 14 in akr1a1b-/-; 18 h postprandial: n = 31 in akr1a1b+/+, n = 16 in akr1a1b-/-, mean ± SD). (B) Schematic depiction of gluconeogenesis and how glucogenic amino acid glutamate serves as substrate. PEPCK: phosphoenolpyruvate carboxykinase; PEP: phosphoenolpyruvate; OAA: oxaloacetate; α-KG: α-ketoglutarate; GLUD1: glutamate dehydrogenase 1. (C) Loss of cytosolic cPEPCK expression in adult Δ+17/Δ-23 akr1a1b-/- kidneys 3 and 18 h after feeding (2 h postprandial: n = 6 in akr1a1b+/+, n = 6 in akr1a1b-/-; 3 h postprandial: n = 9 in akr1a1b+/+, n = 8 in akr1a1b-/-; 18 h postprandial: n = 8 in akr1a1b+/+, n = 7 in akr1a1b-/-, mean ± SD). (D) Loss of cytosolic cPEPCK expression in adult Δ+17/Δ-23 akr1a1b-/- livers 3 h after feeding (2 h postprandial: n = 7 in akr1a1b+/+, n = 7 in akr1a1b-/-; 3 h postprandial: n = 7 in akr1a1b+/+, n = 7 in akr1a1b-/-; 18 h postprandial: n = 5 in akr1a1b+/+, n = 4 in akr1a1b-/-, mean ± SD). cPEPCK expression was analyzed by RT-qPCR and normalized to b2m. ∗p < 0.05, ∗∗p < 0.01, ∗∗∗∗p < 0.0001, p value was calculated by t test.