
|
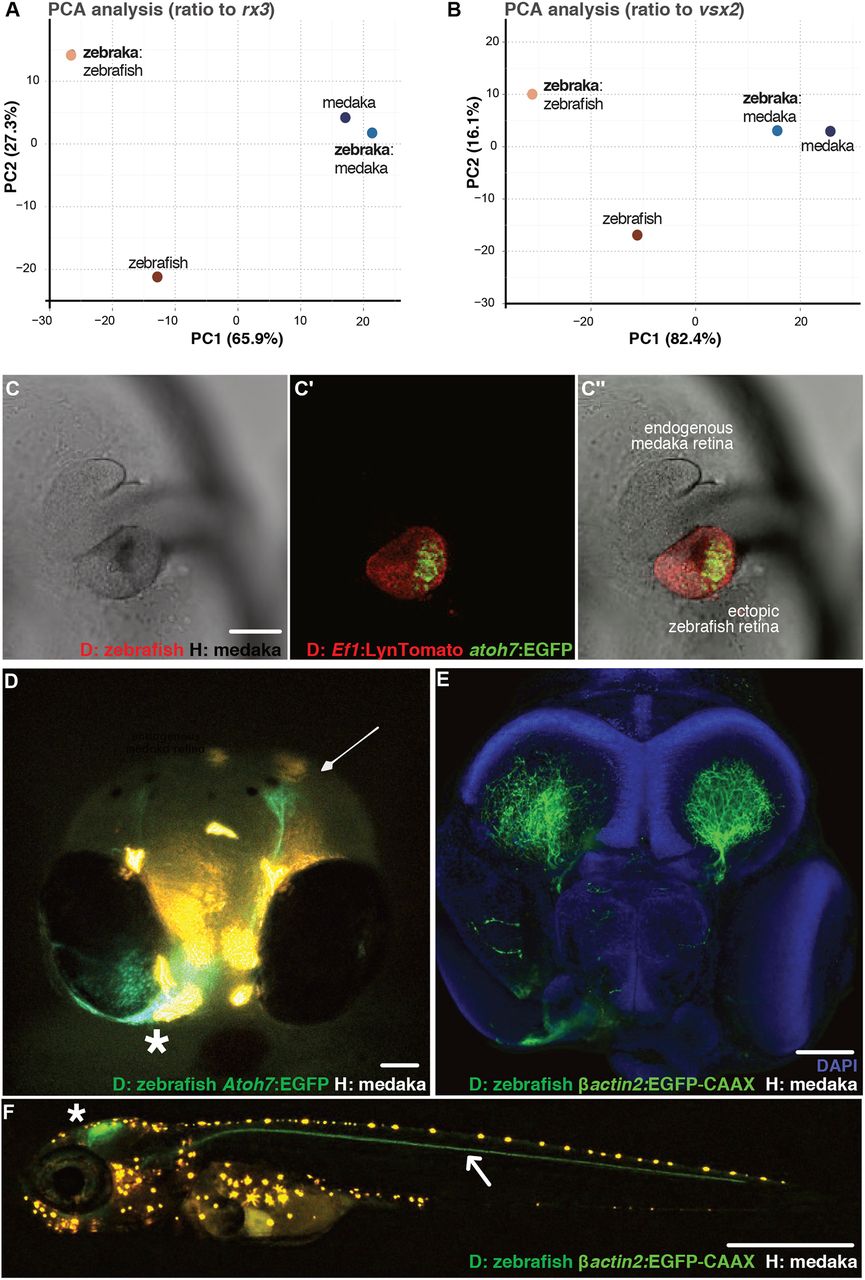
Fig. 6 Retinogenesis follows a genetic developmental time. (A,B) PCA analysis of zebrafish and medaka orthologues expressed in the eye during the 24-48 hpf zebrafish developmental time window. The values are FPKM ratios between retinal genes and retinal progenitor markers rx3 (A) and vsx2 (B). (C-C″) Confocal images of the anterior region in a zebraka where the donor is Tg(Ef1:LynTomato, atoh7:EGFP) (C, transmitted; C′, green and red channels; C″, merged image). EGFP expression in the transplanted cluster (C′,C″) is evident at the vesicle stage of the medaka host (n=3 chimeras). (D) Frontal view of a living 5 dpf zebraka where the donor is Tg(Ef1:LynTomato, atoh7:EGFP). Atoh7+ cells from the ectopic zebrafish retina (asterisk) migrate towards the endogenous medaka tectum (arrow) (n=3 transplantation events, n=6 chimeras). (E) Confocal image of a fixed 6 dpf zebraka where the donor is Tg(Olßactin2:EGFP-CAAX) ubiquitously labelling all donor cell projections (n=2 transplantation events, n=6 chimeras). The ectopic retina projects to both host tecti. (F) Confocal image of a living zebraka at 9 dpf. A nerve coming from the ectopic zebrafish retina (located in the contralateral side) navigates along the posterior lateral line nerve (arrow). Other projections from the ectopic retina, presumably from later RGCs, project to the tectum (asterisk) (n=4 transplantation events, n=7 chimeras). Scale bars: 100 µm in C-E; 1 mm in F. D, donor; H, host. Orange dots in D and F correspond to medaka pigments.