
|
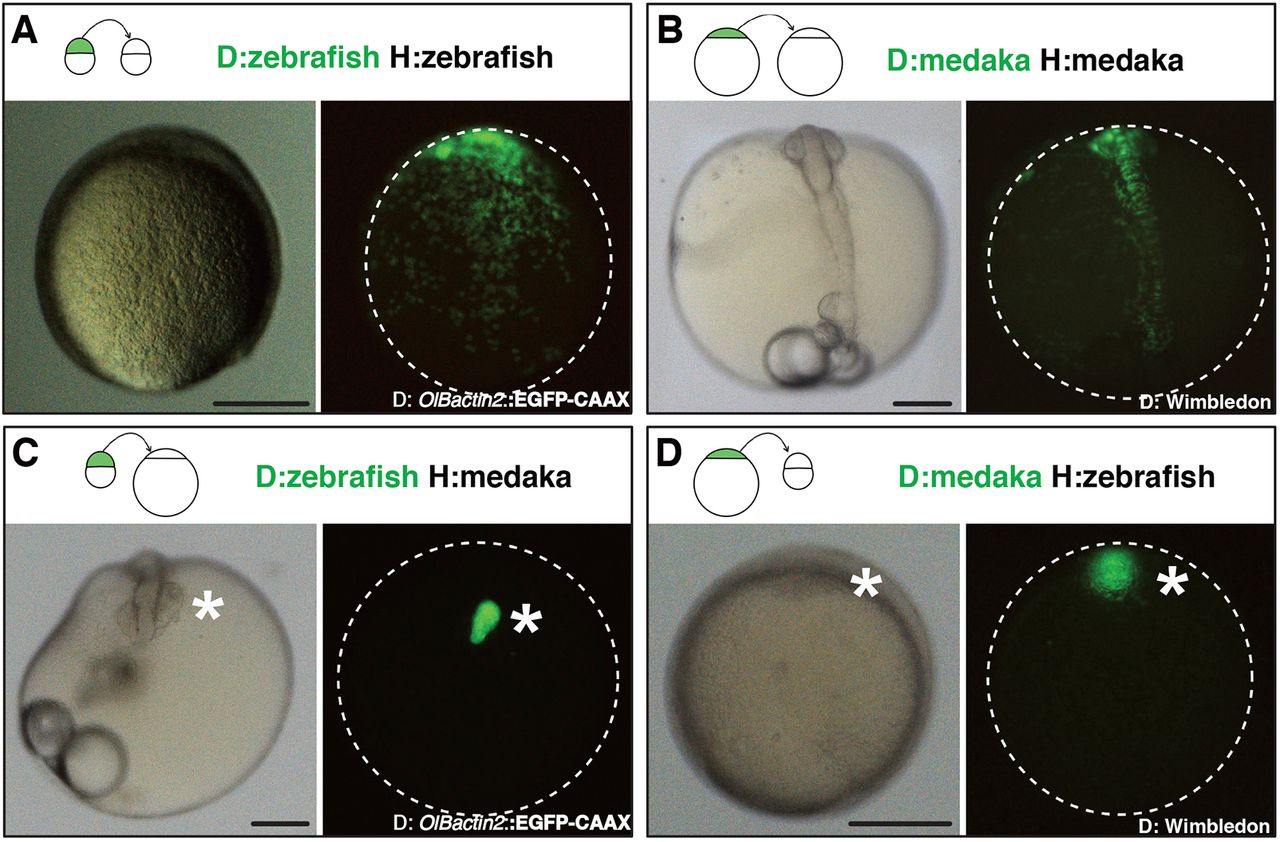
Fig. 2 Intra- and inter-species transplantation of blastocysts in zebrafish and medaka. (A-D) Transmitted (left) and fluorescent (right) images of a non-labelled host embryo that was transplanted at a blastula stage with isochronic EGFP fluorescent cells. Images were taken after completion of initial morphogenesis (90% epiboly stage for zebrafish and early neurula stage for medaka), and transplantation schemes are displayed at the top of each panel. Animal side is up for zebrafish hosts (A,D) and anterior side is up for medaka hosts (B,C). Dispersed green dots in A,B are donor cells intermingled with host cells (n>20 transplantation events for each species, n>10 embryos per transplantation event; a transplantation event is a transplantation experiment performed on a given day with a specific donor-host combination that leads to one or more chimeras of the described phenotype). EGFP+ clusters in C,D (asterisks) contain donor cells that did not mix with host cells. Representative images were chosen out of n=10 zebraka and n=12 medrafish. Clusters of the donor cells were found at later developmental stages in n=17 transplantation experiments, n>100 chimeras for zebraka; n=33 transplantation experiments, n>100 chimeras for medrafish (see Tables S1 and S2). Scale bars: 200 µm. D, donor; H, host.