IMAGE

Figure 6

ID
ZDB-IMAGE-210117-49
Source
Figures for de Latouliere et al., 2021
Image
Figure Caption

Figure 6

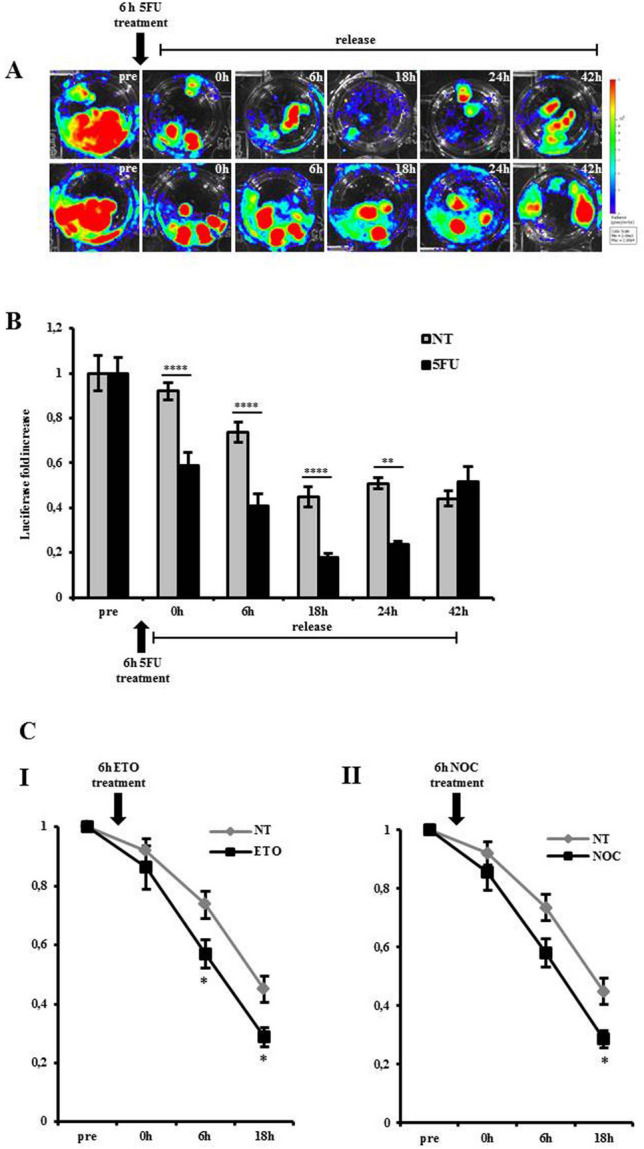
Inhibition of luciferase in zebrafish embryos upon antiproliferative treatments. (A) BLI of a pool of 10 MITO-Luc/GFP embryos before treatment (pre). The embryos have been treated with a pulse of 100 mM 5FU for 6 h as indicated. Upon 5FU washout and replacement with fresh water BLI was measured at time 0, 6, 18, 24 and 42 h. Bottom panel represent untreated control group imaged at the same time points. (B) Relative luciferase activity of a pool of 10 MITO-Luc/GFP embryo extracts collected before treatment. The embryos were treated with a pulse of 100 mM 5FU as indicated. Following 5FU washout and replacement with fresh water embryo extracts were collected at time 0, 6, 18, 24 and 42 h. Gray bars represent untreated control pool extracts collected at the same time points. The error bars are mean standard deviations from three experiments performed in triplicate. Asterisks denote significant differences between control and treated groups assessed by t-test (***p < 0.001****p < 0.0001). (C) Relative luciferase activity of a pool of 10 MITO-Luc/GFP embryo extracts. The embryos were treated with a pulse of 20 mM Etoposide (I) and 150 nM Nocodazole (II) for 6 h as indicated. Upon drug removal and replacement with fresh water embryo extracts were collected at time 0, 6, 18 h. Gray lines represent untreated control pool extracts collected at the same time points. The error bars are mean standard deviations from three experiments. Asterisks denote significant differences between control and treated groups assessed by t-test (*p < 0.05).

Acknowledgments
This image is the copyrighted work of the attributed author or publisher, and ZFIN has permission only to display this image to its users. Additional permissions should be obtained from the applicable author or publisher of the image. Full text @ Sci. Rep.