IMAGE

Figure 5

ID
ZDB-IMAGE-210117-48
Source
Figures for de Latouliere et al., 2021
Image
Figure Caption

Figure 5

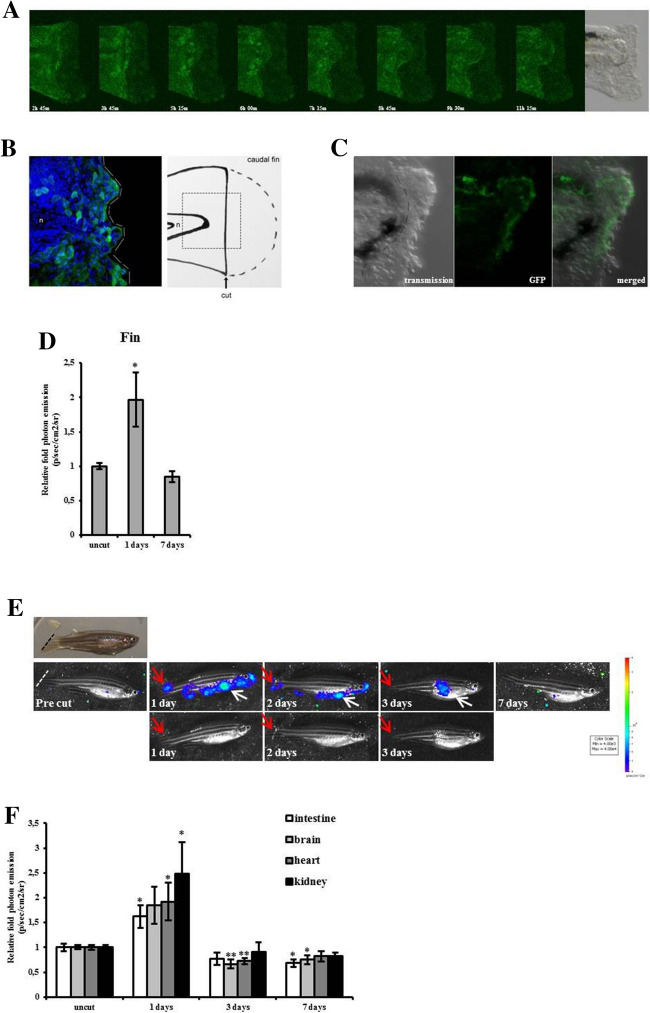
Caudal fin regeneration in MITO-Luc/GFP zebrafish. (A) Summary frame pictures of GFP during caudal fin regeneration in a 3 dpf embryo. The tridimensional images are the results of a merge of nine different layers acquisition (Z-stack). The dynamic of blastoma growth is clearly visible. Bright light image of the fin is shown in the last picture. (B) Immunofluorescence analysis of GFP-DAPI merge 1 day after fin clip in a 3 dpf embryo. The recruitment of GFP positive cells on the marginal edge is visible. Schematic representation of fin clip is shown. Notocord (n) is shown as anatomical reference. (C) Confocal imaging of GFP positive cells during regeneration of the caudal fin in a MITO-Luc/GFP2 2 dpf live embryo. Dotted line in the left image indicates the amputation site, made 24 h before the acquisition. (D) Relative quantification of fin from adult zebrafish after fin clip. Luciferase activity was measured at 1 and 7 days after fin clip. Uncut fins were used as control. The error bars are mean standard deviations from six samples for each group. Asterisks denote significant differences between control and treated groups assessed by t-test (*p < 0.05). (E) BLI of representative MITO-Luc/GFP1 zebrafish longitudinal analysis (pre-cut, 1 day, 2 days, 3 days and 7 days) after fin clip procedure. Red arrows indicate light coming from regenerating caudal fin. White arrows indicate light coming from the abdominal organs. A bright picture and images without luminescence signal are shown for 1, 2 and 3 days as anatomical references. Light emitted from the animals appears in pseudocolor scaling. (F) Ex vivo BLI of zebrafish organs after fin clip. Relative fold induction of photon emission is presented. Luciferase activity was measured in dissected organs from zebrafish sacrificed 1, 3, and 7 days after fin clip. Uncut zebrafish were used as control group. The error bars are mean standard deviations from six fishes for each group. Asterisks denote significant differences between control and treated groups assessed by t-test (*p < 0.05, **p < 0.01).

Acknowledgments
This image is the copyrighted work of the attributed author or publisher, and ZFIN has permission only to display this image to its users. Additional permissions should be obtained from the applicable author or publisher of the image. Full text @ Sci. Rep.