IMAGE

Figure 1

ID
ZDB-IMAGE-210117-46
Source
Figures for de Latouliere et al., 2021
Image
Figure Caption

Figure 1

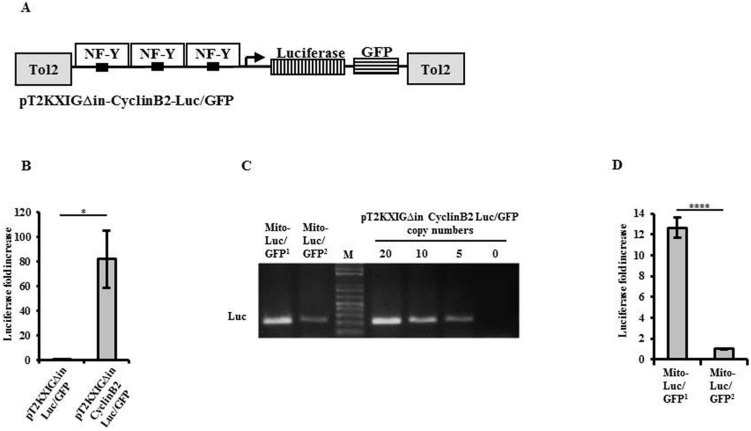
Establishing Tg (cyclin B2:Luc/GFP) MITO-Luc/GFP transgenic zebrafish lines. (A) Schematic representation of the pT2KXIGΔin-cyclin B2-Luc/GFP expression vector. A fragment of murine cyclin B2 promoter containing CCAAT boxes (black) was cloned upstream of the firefly luciferase gene (vertical stripes) and the green fluorescent protein GFP (horizontal stripes), in the pT2KXIGΔin plasmid containing the Tol 2 transposable element (gray). The binding of NF-Y to the CCAT boxes is shown. (B) Relative luciferase activity obtained in one to four-cell stage AB embryos transiently injected with the pT2KXIGΔin-Luc/GFP or the pT2KXIGΔin-cyclin B2-Luc/GFP. The error bars are mean standard deviations from two experiments performed in duplicate. Asterisks denote significant differences between pT2KXIGΔin-cyclin B2-Luc/GFP and empty vector assessed by t-test (*p < 0.05). (C) Quantification of transgene copy number in MITO-Luc/GFP zebrafish lines by quantitative PCR. Amplification of 10/15 transgene copies from MITO-Luc/GFP1 and 1 from MITO-Luc/GFP2 genomic DNA, is quantified by comparing amplifications from known pT2KXIGΔin-cyclin B2-Luc/GFP copy numbers. Full-length gel is presented in Supplementary Figure S17. (D) Relative luciferase activity in MITO-Luc/GFP1 and MITO-Luc/GFP2 zebrafish lines. The error bars are mean standard deviations from two experiments performed at least in triplicate with 3 embryos in each group. Asterisks denote significant differences between MITO-Luc/GFP1 and MITO-Luc/GFP2 embryos assessed by t-test (****p < 0.0001).

Acknowledgments
This image is the copyrighted work of the attributed author or publisher, and ZFIN has permission only to display this image to its users. Additional permissions should be obtained from the applicable author or publisher of the image. Full text @ Sci. Rep.