
Image
|
Figure Caption
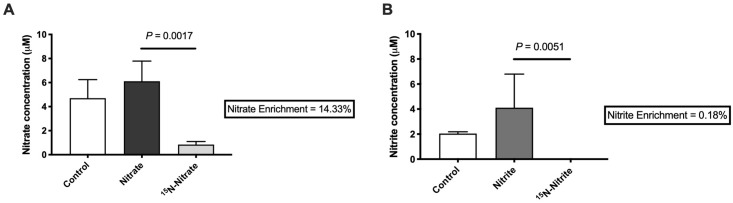
Fig 4
The concentration of (A) nitrate or (B) nitrite was measured using targeted LC-MS/MS in control animals or animals treated with (A) unlabeled and 15N-labeled nitrate, or (B) unlabeled and 15N-labeled nitrite. (A-B) Zebrafish brains were collected on day 31 and percent enrichment (in boxes), indicates the relative amount of nitrate or nitrite in the brain that was derived from the treatment. Bars represent the mean concentration ± SEM (n = 6).
Acknowledgments
This image is the copyrighted work of the attributed author or publisher, and
ZFIN has permission only to display this image to its users.
Additional permissions should be obtained from the applicable author or publisher of the image.
Full text @ PLoS One