
|
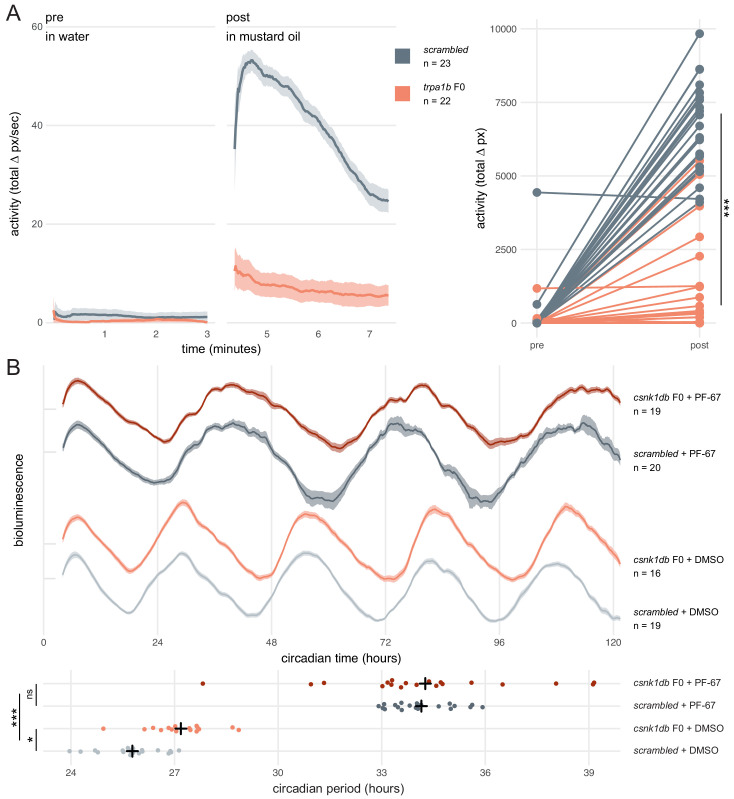
Figure 5 (A) Escape response to mustard oil in trpa1b F0 knockouts. (left) Activity (total Δ pixel/second) of scrambled controls and trpa1b F0 knockout larvae at 4 dpf. Pre: 3-min window before transfer to 1 µM mustard oil. Post: 3-min window immediately after. Traces are mean ± standard error of the mean (SEM). (right) Total activity (sum of Δ pixel/frame over the 3-min window) of individual larvae before and after transfer to 1 µM mustard oil. *** p < 0.001 (Δ total activity scrambled vs trpa1b F0); Welch’s t-test. (B) Circadian rhythm quantification in csnk1db F0 knockout larvae. (top) Timeseries (detrended and normalised) of bioluminescence from per3:luciferase larvae over five subjective day/night cycles (constant dark). Circadian time is the number of hours after the last Zeitgeber (circadian time 0 9 am, morning of 4 dpf). DMSO: 0.001% dimethyl sulfoxide; PF-67: 1 µM PF-670462. Traces are mean ± SEM. (bottom) Circadian period of each larva calculated from its timeseries. Black crosses mark the population means. ns, p = 0.825; * p = 0.024; *** p < 0.001; pairwise Welch’s t-tests with Holm’s p-value adjustment. See also Figure 4—video 1.