
|
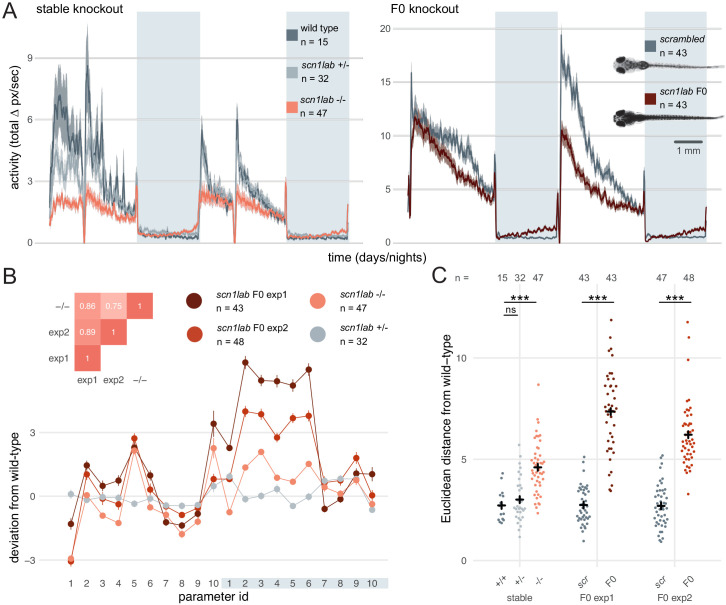
Figure 6 (A) Activity (total Δ pixel/second) of larvae across 2 days (14 hr each, white background) and two nights (10 hr each, grey background). Traces are mean ± SEM. (left) Stable scn1labΔ44 mutant line, from 5 to 7 dpf. The drops in activity in the middle of each day is an artefact caused by topping-up the water. (right) scn1lab F0 knockout, from 6 to 8 dpf. This replicate is called scn1lab F0 experiment 1 in B and C. (inset) Pictures of example scrambled-injected control and scn1lab F0 larvae at 6 dpf. (B) Behavioural fingerprints, represented as deviation from the paired wild-type mean (Z-score, mean ± SEM). 10 parameters describe bout structure during the day and night (grey underlay). Parameters 1–6 describe the swimming (active) bouts, 7–9 the activity during each day/night, and 10 is pause (inactive bout) length. (inset) Pairwise correlations (Pearson) between mean fingerprints. (C) Euclidean distance of individual larvae from the paired wild-type or scrambled-injected (scr) mean. Black crosses mark the population means. ns, p > 0.999; *** p < 0.001; pairwise Welch’s t-tests with Holm’s p-value adjustment. See also Figure 6—figure supplement 1.