
|
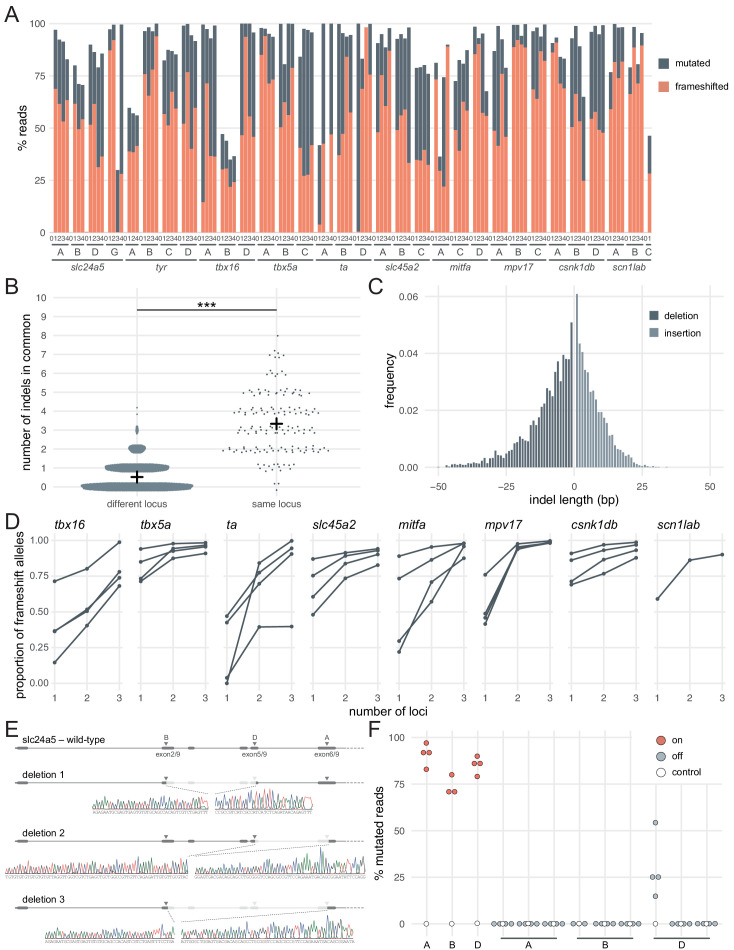
Figure 2 (A) Percentage of reads mutated (height of each bar, grey) and percentage of reads with a frameshift mutation (orange) at each gene, locus (capital letters refer to IDT’s database), larva (within each gene, the same number refers to the same individual animal; 0 is uninjected control). (B) Number of indels in common when intersecting the top 10 most frequent indels of two samples from different loci or from the same locus but different animals. Black crosses mark the means. *** p < 0.001; Welch’s t-test. (C) Frequency of each indel length (bp). Negative lengths: deletions, positive lengths: insertions. (D) Proportion of alleles harbouring a frameshift mutation if 1, 2, or three3 loci in the same gene were targeted, based on deep sequencing of each targeted locus. Each line corresponds to an individual animal. (E) Sanger sequencing of amplicons spanning multiple targeted loci of slc24a5. Arrowheads indicate each protospacer adjacent motif (PAM), capital letters refer to the crRNA/locus name. (F) Deep sequencing of the top 3 predicted off-targets of each slc24a5 gRNA (A, B, D). Each data point corresponds to one locus in one animal. Percentage of mutated reads at on-targets is the same data as in A (slc24a5 loci A, B, D). See also Figure 2—figure supplement 1.