IMAGE

FIGURE 8

ID
ZDB-IMAGE-210113-43
Source
Figures for Langenbacher et al., 2020
Image
Figure Caption

FIGURE 8

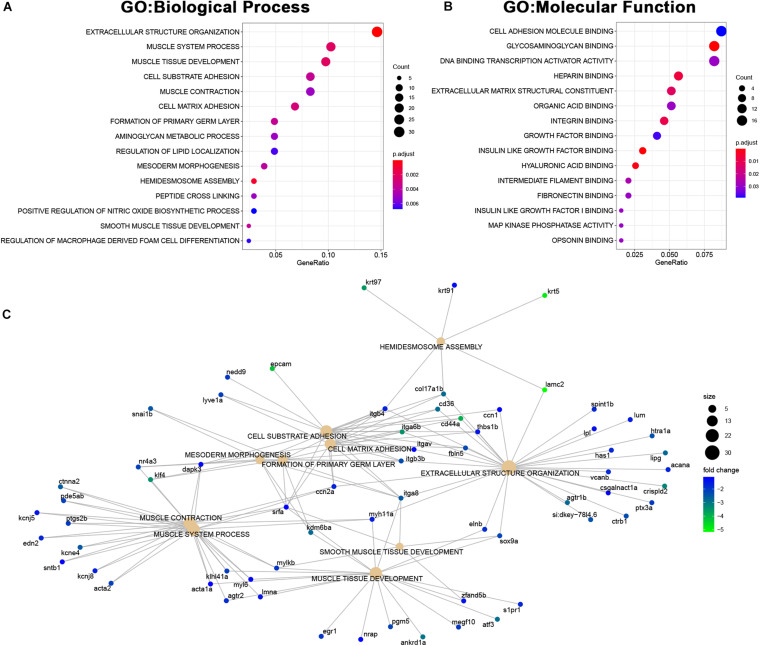
Downregulated genes in MCU hearts suggest defects in cardiac structure and function. (A,B) Dot plots of over-represented Biological Process (A) and Molecular Function (B) gene ontology terms in the set of genes that is significantly downregulated in MCU mutant hearts. The dot size indicates the number of genes associated with each term and the dot color indicates the significance of the enrichment (adjusted p-values). (C) Gene concept networks of the top 10 over-represented Biological Process gene ontology terms in the set of genes that is significantly downregulated in MCU mutants. The dot size indicates the number of genes associated with each term and dots representing genes are colored based on their fold-change [log2(fold-change)].

Acknowledgments
This image is the copyrighted work of the attributed author or publisher, and ZFIN has permission only to display this image to its users. Additional permissions should be obtained from the applicable author or publisher of the image. Full text @ Front. Physiol.