IMAGE

FIGURE 6

ID
ZDB-IMAGE-210113-40
Source
Figures for Langenbacher et al., 2020
Image
Figure Caption

FIGURE 6

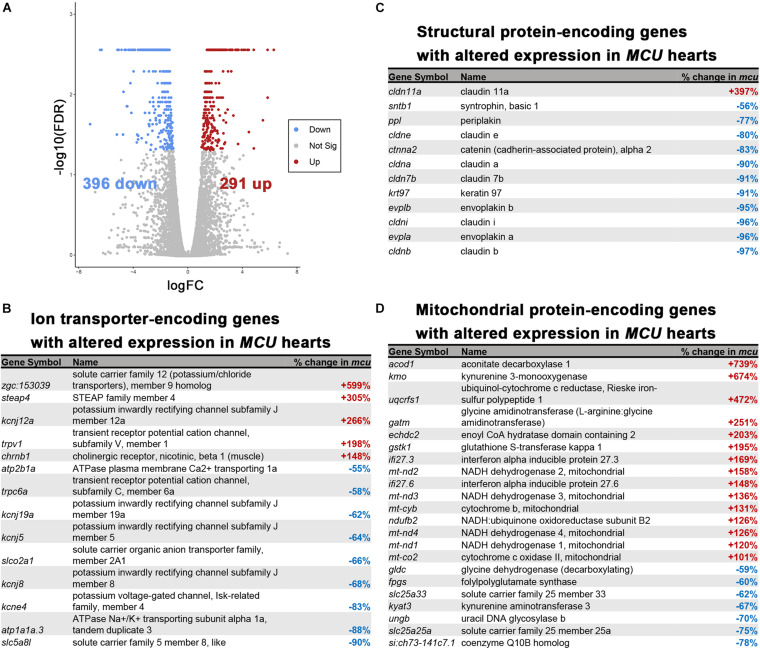
RNA-seq analysis of the MCU mutant adult heart. (A) Volcano plot of differential gene expression of MCU mutant hearts vs. wildtype. Each point represents the average value of one transcript in duplicate experiments. The expression difference is considered significant for an adjusted p-value (FDR) of less than 0.05. Red points represent genes significantly upregulated in MCU mutants and blue points represent significantly down regulated genes. FDR, false-discovery rate. (B–D) Selected lists of significantly differentially expressed (FDR < 0.05) ion transporter-encoding (B), structural protein-encoding (C), and mitochondrial protein-encoding (D) genes. The percent increase (+, red) or decrease (-, blue) in expression in MCU compared to WT, based on the fold-changes determined by Cufflinks, is displayed in the right column.

Acknowledgments
This image is the copyrighted work of the attributed author or publisher, and ZFIN has permission only to display this image to its users. Additional permissions should be obtained from the applicable author or publisher of the image. Full text @ Front. Physiol.