IMAGE

Figure 8

ID
ZDB-IMAGE-210113-18
Source
Figures for Danesin et al., 2021
Image
Figure Caption

Figure 8

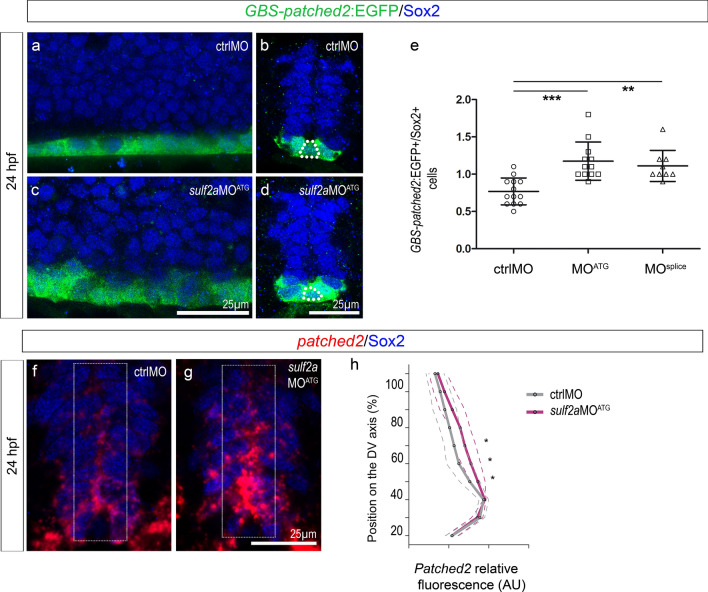
Sulf2a restricts dorsal extent of the high-threshold Shh response without affecting expression of shh. Side views (a,c) and transverse sections (b,d,f,g) of 24 hpf embryos. a-d: Immunostaining of Sox2 in Tg(GBS-ptch2:EGFP) embryos injected with ctrlMO (a,b) or sulf2aMOATG (c,d). Dotted lines in b and d delineate the medial floor plate. Note the dorsal expansion of the GBS-ptch2:EGFP signal in sulf2a morphants. (e) Quantification of GBS-ptch2:EGFP + /Sox2 + cells in embryos injected with ctrlMO (n = 13), sulf2aMOATG (n = 12) or sulf2aMOsplice (n = 9) from two independent experiments. Datasets were compared with Mann Whitney’s test (two-tailed). Data are presented as mean number of cells along the dorso-ventral axis on each side of the lumen per embryo ± s.d (***p < 0.0005, ** p < 0.005). (f–h) Double detection of patched2 mRNA (red, f, g) and Sox2 (blue, f, g) in embryos injected with ctrlMO (f, n = 5) or sulf2aMOATG (g, n = 5). Patched2 relative fluorescence intensity in neural progenitors (white frame in f,g) was quantified along the dorso-ventral (DV) axis (grey line for ctrlMO and purple for sulf2aMOATG). Datasets were compared with two-way ANOVA test. Data are presented in arbitrary units of fluorescence (AU; mean values ± s.d) along the DV axis per section (*p < 0.005).

Figure Data
Acknowledgments
This image is the copyrighted work of the attributed author or publisher, and ZFIN has permission only to display this image to its users. Additional permissions should be obtained from the applicable author or publisher of the image. Full text @ Sci. Rep.