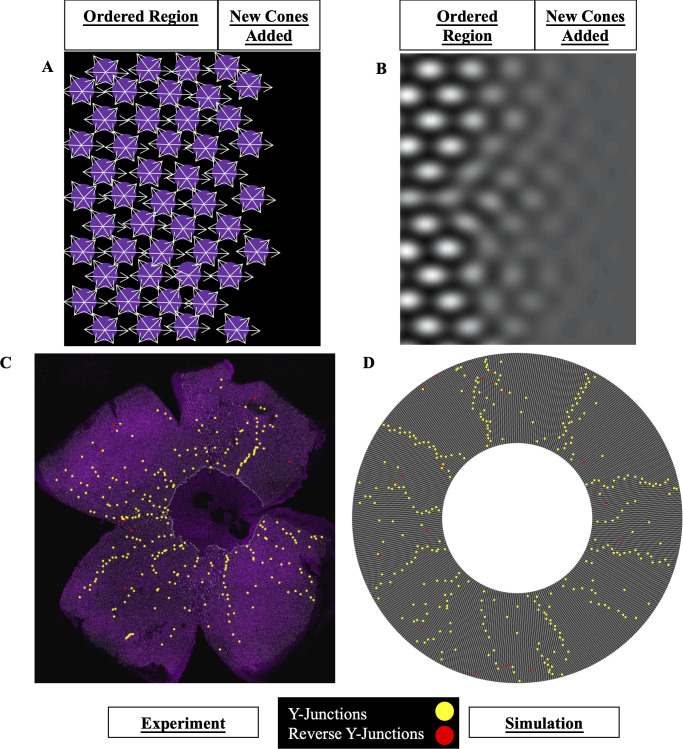
IMAGE

Fig 7

ID
ZDB-IMAGE-210113-124
Source
Figures for Nunley et al., 2020
Image
Figure Caption

Fig 7 Phase-field crystal model of cone mosaic formation.

(A) Schematic of contact-interaction model in which fate-committed cones interact homotypically and form an anisotropic lattice. UV cones (magenta circles) interact with nearest neighbors of same subtype. White arrows: contact interactions. New fate-committed cones are incorporated to right of the ordered region. (B) In the phase-field crystal model, a continuum field describes the positions of UV cones. UV cones are most likely to be found around peaks in the density (white regions) and least likely to be found in troughs (dark regions). (C) Flat-mounted retina (same as Fig 3A and 3B) in which UV cones express a transgenic reporter under control of the UV cone opsin promoter. Yellow dots: Y-Junctions. Red dots: reverse Y-Junctions. (D) Simulation of phase-field crystal model on the surface of a cone. The number of initial rows and total number of columns are comparable to those in retinae, and this leads to a defect density similar to that measured in experiments. The degree of anisotropy of the triangular lattice is constrained by the anisotropy in unit cell dimensions measured in our live-imaging experiments. Yellow dots: Y-Junctions. Red dots: reverse Y-Junctions.

Acknowledgments
This image is the copyrighted work of the attributed author or publisher, and ZFIN has permission only to display this image to its users. Additional permissions should be obtained from the applicable author or publisher of the image. Full text @ PLoS Comput. Biol.