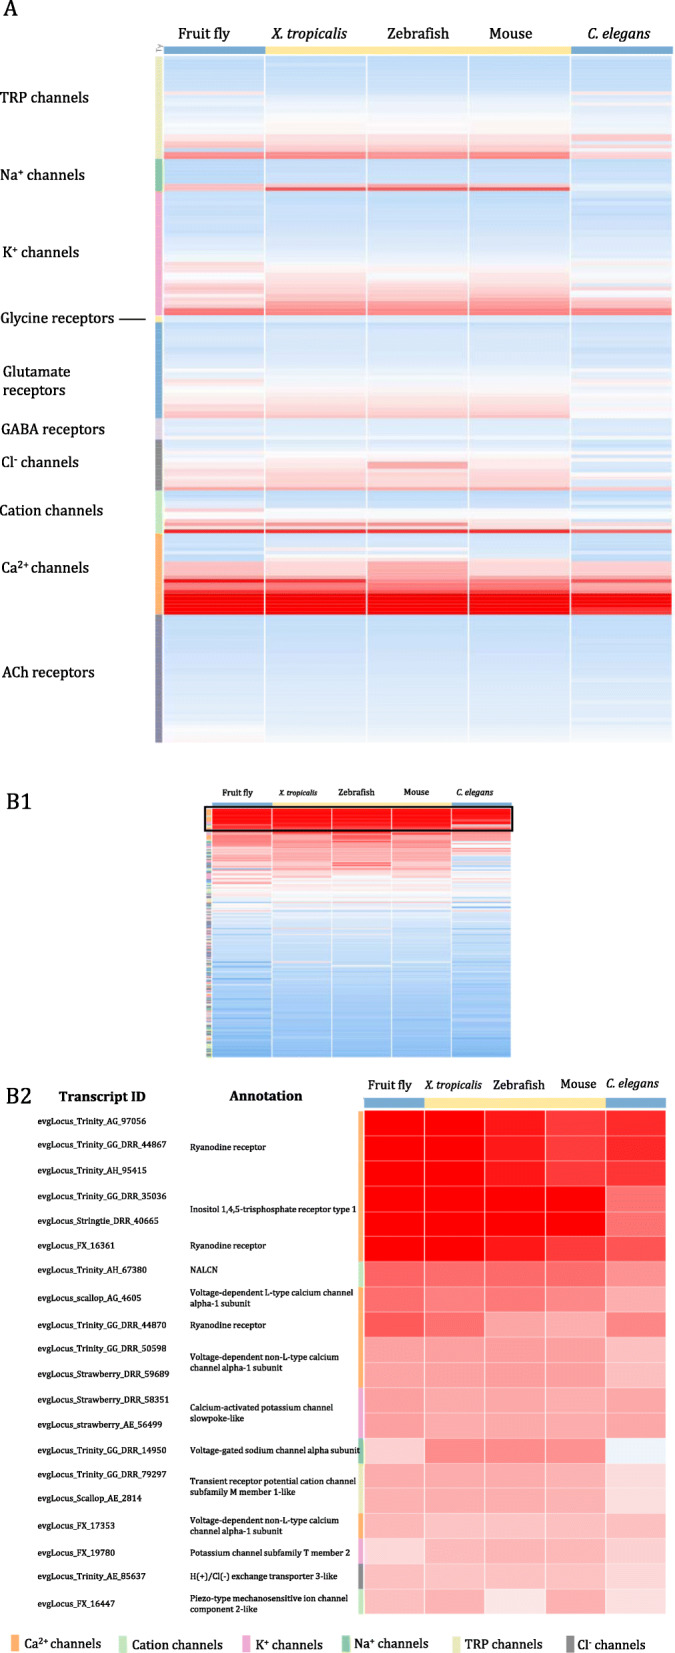
Heat maps of protein sequence similarity as measured by BLASTP bitscore between putative L. stagnalis ion channel/ionotropic receptor transcripts and homologs in mouse, X. tropicalis, zebrafish, fruit fly and C. elegans. Each bitscore is standardized by the average and standard deviation of all bitscores in the matrix. Each row corresponds to a single L. stagnalis transcript and each column to a species, such that each cell represents a standardized bitscore. Colour of each cell is proportional to the bitscore, where a darker colour indicates higher bitscore and consequently sequence similarity. A, Transcripts are sorted by the ion channel/ionotropic receptor class and species are sorted in descending order by the absolute sum of bitscores of its homologs, i.e. species with the highest bitscores across all transcripts is on the left of the heatmap. Transcripts encoding Ca2+ and cation channels appear to share the greatest sequence similarity across all six species. B1 Transcripts are sorted in descending order by the absolute sum of bitscores, i.e. transcripts with the highest sequence similarities across species are at the top of the heatmap. B2 The top 20 transcripts thus ranked are labeled by transcript ID and annotation. The colour scale is adjusted as compared to in B1 to increase contrast between cells. Interactive Clustergrammer heat map can be accessed at http://amp.pharm.mssm.edu/clustergrammer/viz/5b6ba1ca7226c37ceda3505b/LS_channel_comparisons.txt. The majority of these top 20 transcripts encode calcium channels
Acknowledgments
This image is the copyrighted work of the attributed author or publisher, and
ZFIN has permission only to display this image to its users.
Additional permissions should be obtained from the applicable author or publisher of the image.
Full text @ BMC Genomics
Your Input Welcome
Thank you for submitting comments. Your input has been emailed to ZFIN curators who may contact you if
additional information is required.
Oops. Something went wrong. Please try again later.