
|
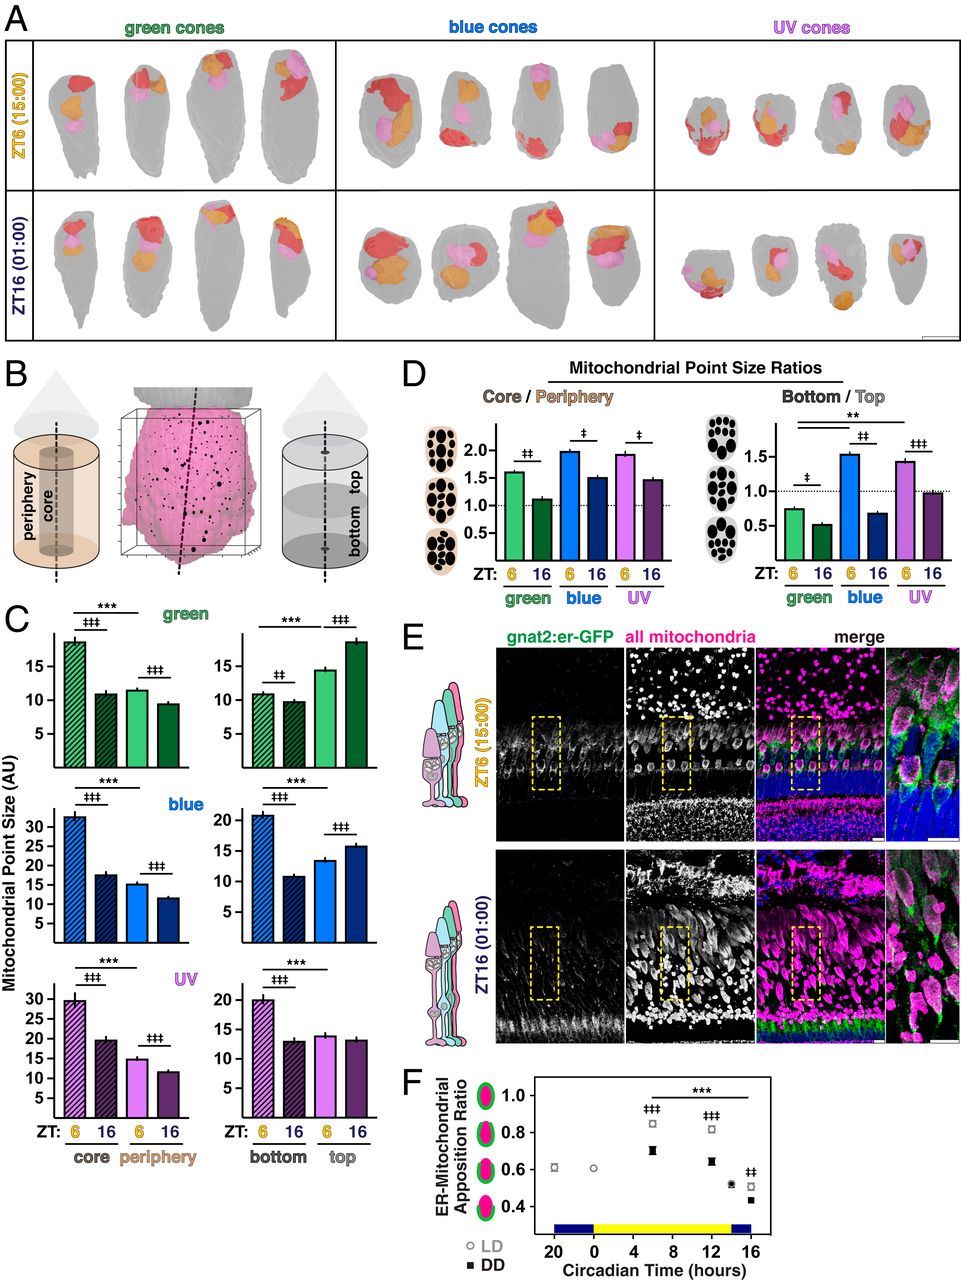
Fig. 3 Distribution of mitochondrial size across the cluster changes throughout the day. (A) Three-dimensional renderings of the three largest mitochondria in manually segmented cones at ZT6 and ZT16. OSs are oriented toward the top; ellipsoids, gray. Largest mitochondrion, red; middle, orange and smallest, pink. (Scale bar, 5 µm.) (B) Three-dimensional rendering of cone ellipsoid (magenta) and OS (gray) overlaid with the corresponding point cloud. Individual mitochondria are represented at their X-Y-Z locations; point size corresponds to relative mitochondrial size. Points were separated into core and peripheral or top and bottom populations. Axis ticks, 1 µm. (C) Quantification of mean mitochondrial point size in regions of the cluster for cone subtypes at ZT6 and ZT16. (D) Mitochondrial point size ratios quantifying regional core–periphery and bottom–top distributions of mitochondrial size reported in C for cone subtypes at ZT6 and ZT16. In C and D, ‡P < 0.05; **P < 0.01; ‡‡P < 0.001; ***,‡‡‡P < 0.0001. (E) IHC images of transgenic zebrafish outer retina expressing cone-targeted er-GFP (green) overlaid with mitochondrial and nuclear stains (magenta and blue, respectively) at ZT6 and ZT16. Yellow boxes, zoomed-in areas. (Scale bars, 10 µm.) (F) Quantification of mean ER–mitochondrial apposition in blue and UV cones from IHC for LD or DD groups. ‡‡P < 0.01. ***,‡‡‡P < 0.0001. SI Appendix, Table S2 lists statistical information and Ns from all groups.